|
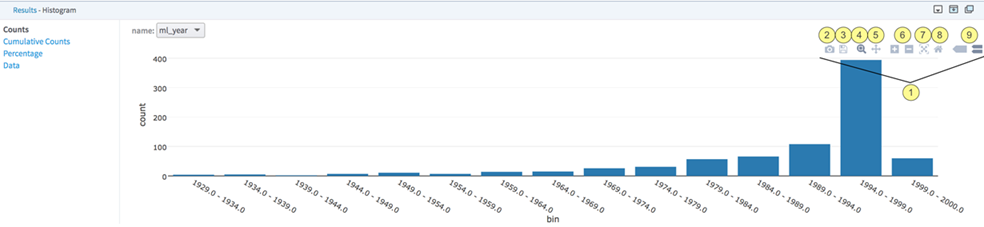
To find the available actions, hover in the top right corner of your visualization.
|

|
To download the visualization to your computer as a
PNG file, use the Camera icon.
|

|
To export your visualization to the Plotly online chart editor, use the
Save icon. From the Plotly online chart editor, you can modify colors, data sort orders, and other characteristics of your visualization.
|

|
To zoom for more detail of a visualization area, click and drag that area. This is the default action when you open the Plotly chart. If you change the default action, you can return to this option by clicking the associated icon, labeled in the image
|

|
To switch from zoom to pan, use the
Pan icon.
|

|
To zoom manually, use
[+] and
[-].
|

|
To autoscale your visualization, use the crossed arrows icon.
|

|
To return to the original view, click the
Home icon.
|

|
To display hover information, choose one of the two options: One shows values on both axes, and the other shows only the primary axis value.
|