Procedure: How to Add an RSS Feed to an Esri Map
The RSS feed is added as an RSS layer on the map.
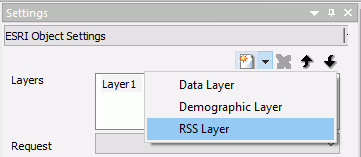
- Add a new layer to the Esri map using the Settings panel, and select RSS Layer, as shown in the following image.
An RSS layer is added, as shown in the following image.
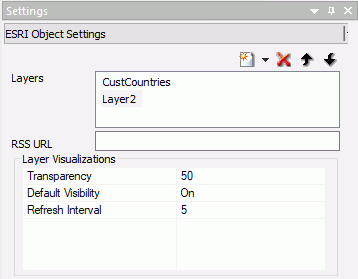
The layer name cannot be changed by the user, the default name must be used.
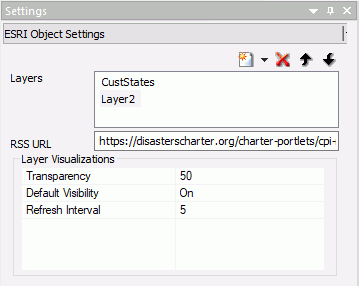
- Configure the following properties.
- RSS URL. Enter the URL to the RSS feed that you want to display on the map.
- Transparency. Enter a transparency percentage (where 0 is totally transparent, and 100 is totally opaque), or accept the default transparency, 50%.
- Default Visibility. The default is On. To make the layer not visible, select Off.
- Refresh Interval. Enter a number of seconds for the interval to refresh the RSS layer. The default value is 5.
- Run the map.
RSS feed symbols display on locations that have data for the RSS feed. Clicking an RSS feed symbol displays the feed data for that location.
Example: Adding an RSS Layer to an Esri Map
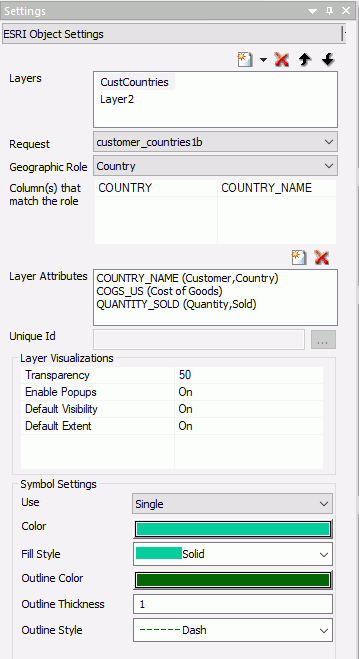
The following map has a data layer with the geographic role Country that uses the following WebFOCUS request, customer_countries1b.fex.
TABLE FILE WF_RETAIL_LITE
SUM
  COGS_US
  QUANTITY_SOLD
BY COUNTRY_NAME
ON TABLE NOTOTAL
ON TABLE PCHOLD FORMAT XML
END
The Settings panel for the data layer is shown in the following image.
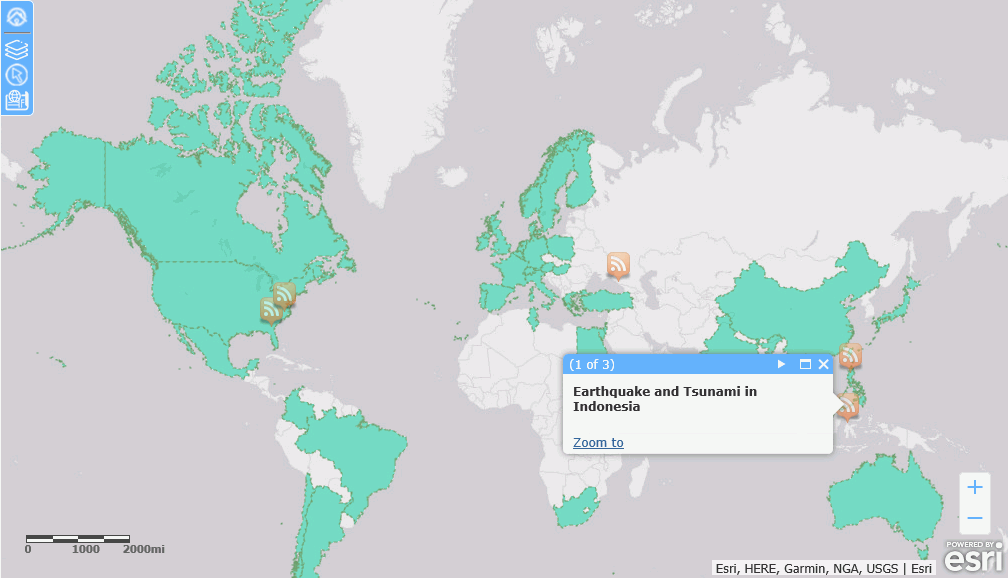
An RSS layer is added pointing to the following URL, which is a disaster RSS feed, and the remaining properties are set to the defaults.
https://disasterscharter.org/charter-portlets/cpi-mvc/activations/feed/rss/
The RSS Layer properties are shown in the following image.
The output is shown in the following image, with one of the RSS symbols clicked to show the disaster information for that location.