You can use WebFOCUS App Studio features and functions to develop applications in the canvas area. The canvas is designed to maximize your design-time options. At run time, elements appear in the browser based on the order in which they were added to the canvas, left to right, and top to bottom. Your canvas may have the same appearance as the browser at run time, but it is not required. You can drag elements to areas of the canvas as needed to make it easier to work with them.
The size of your canvas depends on the placement and location of panels around the interface window.
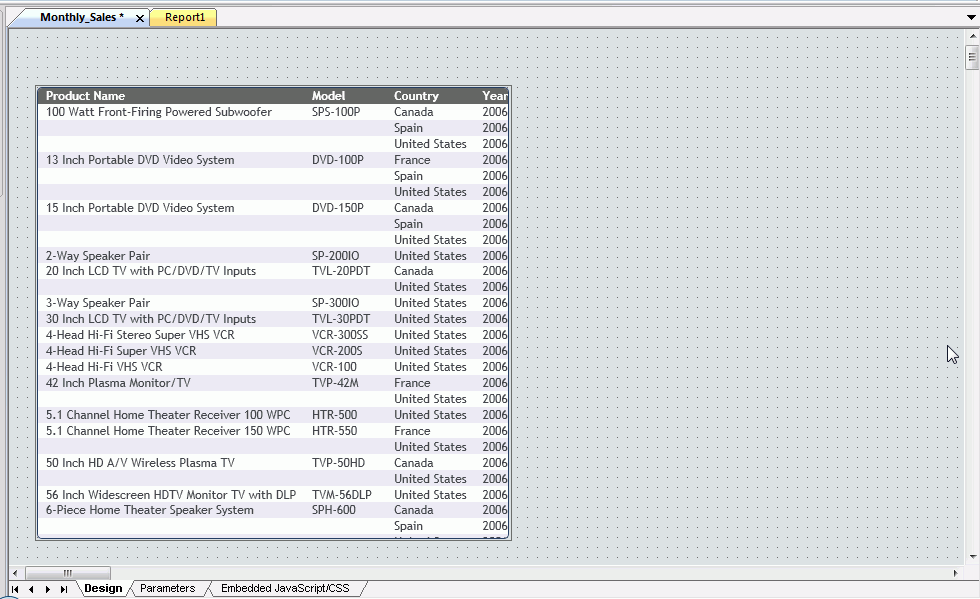
As you develop in WebFOCUS App Studio, tabs open in the canvas area. Since you can develop an HTML page at the same time that you create a report, each canvas opens with a different colored tab. The colored tab at the top of each canvas displays the name of the file you are developing.
If you chose to name the file after you develop the content, a default file name, such as Report1, appears on the tab, as shown in the following image.
A second set of tabs opens when you create procedures with multiple components. For example, you can add Set, Define, and Join components to a procedure at any time. These canvases open as tabs below the report or chart procedure, as shown in the following image.
In addition to colored tabs, some canvases also contain View tabs. A View tab appears at the bottom of the canvas and changes the display of information on the canvas. View tabs, which display different views of the same component, are shown in the following image.
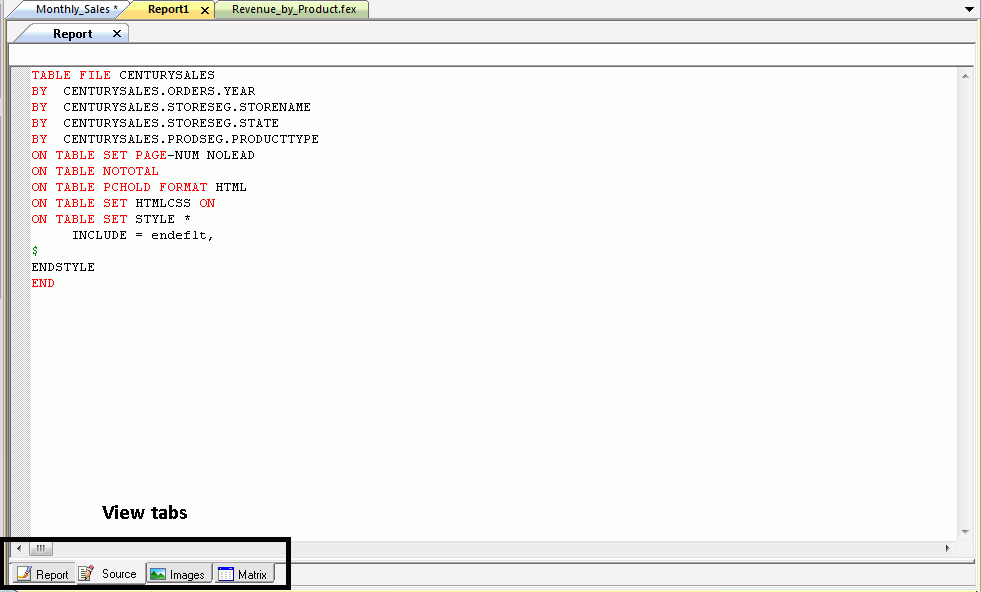
View tabs, such as those on the HTML canvas, also enable additional features and functions that you can use to customize an application. For example, in the HTML canvas, you can add JavaScript functionality to an HTML page through the Embedded JavaScript view tab.
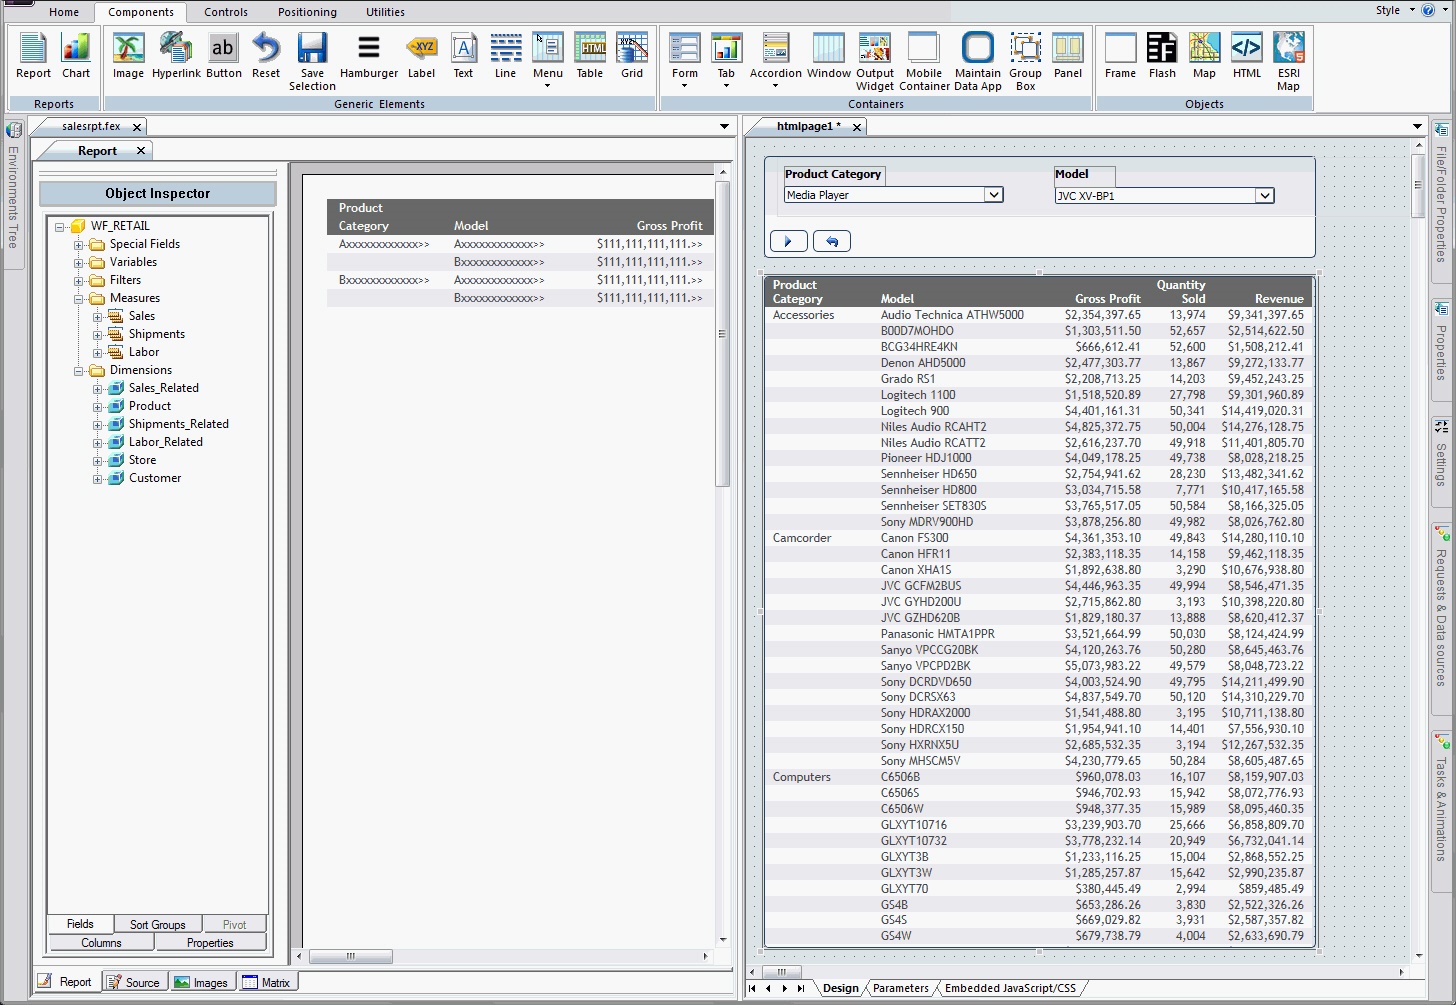
You can develop WebFOCUS App Studio content in the following canvases.
In this section: |
The Alert Assist canvas, which opens in your browser window, enables you to distribute an entire report or selected sections of a report when certain test conditions are met.
To access the online Help for the Alert Assist canvas, click the Alert Assist Help icon , located within the Alert Assist canvas.
The Alert Assist button opens a menu that contains the Save, Save As, Run, and Close buttons.
You can access frequently used commands on the Alert Assist Quick Access Toolbar, such as Save, Undo, Redo, View code, and Run.
You can use the Alert Assist Home tab to access the features and functions necessary to create, open, edit or run an Alert Test or Alert Result. The Alert Assist Home tab contains the Navigation group.
You can create a new Alert Test or Alert Result, open a previously created Alert Test or Alert Result, edit a previously created Alert Test or Alert Result, and run the report in a new browser window. The commands are:
You can create a new Alert Test or Alert Result by selecting Test or Result, and then clicking New. This opens a menu from which you can choose to create a new WebFOCUS Report or Test for File Existence. New provides the same functionality as if you right clicked the Test node and created a report from the menu.
You can open a previously created Alert Test or Alert Result. This invokes the Chart canvas so that you can make changes to the chart. The Open option is activated only after a report test is created.
You can edit an Alert Test or Alert Result. This opens the Report on FILENAME data source dialog box. Here, you can edit the report in the Text Editor canvas.
You can run the report in a new browser window.
You can remove the report from the Alert Test or Alert Result. The command is:
You can remove the report from the Alert Test or Alert Result.
The Chart canvas enables you to create different types of charts. You can select from a variety of chart types and output formats, and add custom features to a chart. To access the Chart canvas, on the Home tab, in the Content group, click Chart. The Chart Wizard opens InfoAssist in a separate browser window.
The Cascading Style Sheet canvas allows you to create a cascading style sheet. To access the Cascading Style Sheet canvas, right-click any folder or file in the Environments Tree panel and in the shortcut menu point to New, and then click Cascading Style Sheet.
The Esri Configuration Utility canvas allows you to edit configuration options associated with Esri, the ArcGIS Server, and the GIS Adapter. To access the Esri Configuration Utility canvas, right-click an Application folder in the Data Servers area, point to New, and click XML Document with Esri Configuration.
The Embedded JavaScript canvas and the Embedded CSS canvas have a built-in Auto Complete feature to assist in the creation of code segments, similar to functionality offered by Microsoft IntelliSense® and other code editors. When you begin typing a string, array, number, or user-defined object, a list of available JavaScript methods, related to those code segments, displays.
The Auto Complete feature is on by default. To turn it off, right-click in the Cascading Style Sheet canvas and clear Auto Complete from the shortcut menu.
Note: If there is a syntax error, the Auto Complete features will not display.
The Text Editor canvas allows you to edit component code. To access the Text Editor canvas, right-click a component in the Procedure View panel, point to Open With, and then click Text Editor.
The Document canvas enables you to design reports, and to coordinate and distribute layouts made up of multiple reports and charts in a document. You can position reports and charts anywhere on a single page or combine a series of layouts within a single document. To access the Document canvas, on the Home tab, in the Content group, click HTML/Document. When the HTML/Document Wizard opens, select Document from the available options. The Document canvas opens.
The HTML canvas enables you to create HTML pages for WebFOCUS App Studio. Designed for business users, you do not need to have experience in HTML, CSS, XML, or JavaScript. The HTML canvas is a graphical interface that is easy to use.
Note: HTML canvas files are intended to be created and edited with the HTML canvas only. You can either modify HTML pages created in the HTML canvas or create HTML pages using a text editor. When these pages are opened in the canvas, a message displays that allows you to decide whether to open the file in the canvas or the text editor.
If you are a web developer and want to write your own code instead of using the HTML canvas, you can use the authoring tool of your choice and also use RESTful Web Services. To do so, you must license the WebFOCUS Web Services Enablement Option. For more information on RESTful Web Services, see the TIBCO WebFOCUS® Embedded Business Intelligence User's Guide.
Note: When opening an HTML file that was not created in the HTML canvas, you will be prompted to open the file only in a Windows Associated tool.
To access the HTML canvas, on the Home tab, in the Content group, click HTML/Document. When the HTML/Document Wizard opens, select HTML Page from the available options. The HTML canvas opens.
The HTML canvas uses HTML 5 Document Type Definitions (DTD).
The OLAP Dimensions canvas allows you to create temporary OLAP hierarchy and dimensions. To access the OLAP Dimensions canvas, right-click a procedure folder or component in the Procedure View panel, point to New, and then click Olap Dimensions.
Note: This option only appears if you select the Enable OLAP check box in the Reporting tab of the App Studio Options dialog box.
The Report canvas provides you with many features that enable you to create and style reports. To access the Report canvas, on the Home tab, in the Content group, click Report. The Report Wizard opens. Follow the prompts in the Report Wizard to create a report. The Report canvas opens.
In this section: |
The Reporting Object canvas enables you to present available data using different terms and formats. You can then use Reporting Objects, which opens in a separate browser window, as templates for the creation of a wide range of reports and charts.
To access the online Help for the Reporting Object canvas, click the Reporting Object Help icon , located within the Reporting Object canvas.
The Reporting Object button opens a menu that contains the Save, Save As, Run, and Close buttons.
You can access frequently used commands on the Reporting Object Quick Access Toolbar, such as Save, Undo, Redo, View code, and Run.
You can use the Reporting Object Home tab to access the features and functions necessary to create, open, edit or run an item. The Reporting Object Home tab contains the Navigation group.
You can create a new item, open a previously created item in the respective canvas, edit a previously created item, rename an item, and run the item The commands are:
You can create a new join, DEFINE statement, filter, or WHERE statement.
You can open a previously created item in the appropriate canvas.
You can open the item source code in the Text Editor canvas.
You can rename the selected filter or filter group.
You can run the selected item.
You can delete a selected item or all items of a specific type. The commands are:
You can delete the selected item.
You can delete all items of the selected item type. For example, all WHERE statements, all filters in a particular group, or all filters in every group.
The Join canvas allows you to temporarily join two or more data sources and use data from them as if they were one data source. Joined files remain physically separate but are treated as one data source. To access the Join canvas, right-click a procedure folder or component in the Procedure View panel, point to New, and then click Join.
The Set canvas provides you with a graphical option for issuing a SET command. You can use the SET command to change parameters that govern App Studio and your environment. To access the Set canvas, right-click a procedure folder or component in the Procedure View panel, point to New, and then click Set.
The Create URL dialog box allows you to create a URL file. You can add URL files to other content, such as HTML pages or portal pages, to show the target of the URL. When you create a new URL file, you can set the title of the URL file, an optional summary, and the URL address that the file points to. To access the Create URL dialog box, right-click a domain or folder in the Environments Tree panel, point to New, point to Other, and click URL.
The Use canvas enables you to specify the name and location of a WebFOCUS data source. This is helpful if the default naming convention is not used, the data source cannot be found on the standard search path, or an explicit extra option is desired. To access the Use canvas, right-click a procedure folder or component in the Procedure View panel, point to New, and then click Use.
How to: |
You can switch between the canvases by clicking the colored tab at the top of the canvas. You can also develop in the canvases side by side.
To create side-by-side canvas development, follow these steps:
A pointer with a document icon appears.
The canvases now appear side by side.
Tip: Repeat the preceding steps to develop on additional canvases side by side.