Procedure: How to Blend Data Using the Join Tab
This procedure describes how to blend data from two existing data sources. It uses the wf_retail Master File and the product_category_sales spreadsheet.
- Create a new procedure or open an existing procedure.
- In the Procedure View panel, right-click the procedure folder or the component that you want to create the Join after, point to New, and click Join.
- Select the wf_retail data source from the Select a Data
Source dialog box and click OK.
The Join canvas opens and displays the fields in the Master File.
- Select the Join tab on the ribbon and in the Join group,
click Add.
You can also right-click in the Join canvas and select Add File to add the second part of the join.
- Select the product_category_sales spreadsheet from the
Select a Data Source dialog box and click OK.
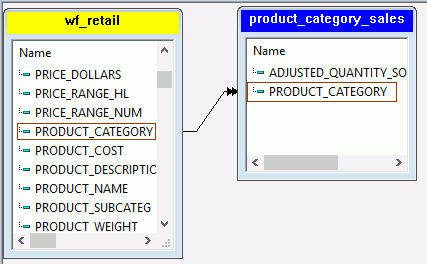
The new file is added to the canvas. Common fields in both files are linked by a Join connector line, as shown in the following image.

- To blend the data in the join, select the linked field in each file list, and click the Join connector line.
- In the Join tab on the ribbon, click the Blend option.
- Select Inner (default) or Full Outer as the Blend type.
- Click Run.
A dialog box opens, displaying the component code, and either an error message or text stating that no error exists.
Example: Blending Data Using WebFOCUS Syntax
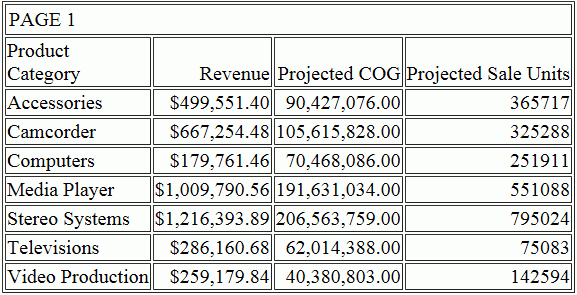
You can blend data using the following JOIN AS_ROOT command, which you can type into a procedure using the Text Editor. In this example, the Projected Excel worksheet is added as a parent of the wf_retail Product dimension. The report output contains field values from the wf_retail_sales fact table and the Projected Excel worksheet for each product category.
JOIN AS_ROOT PRODUCT_CATEGORY IN WF_RETAIL TO UNIQUE PRODUCT_CATEGORY IN PROJECTED
END
TABLE FILE wf_retail
SUM REVENUE_US
PROJECTED_COG
PROJECTED_SALE_UNITS
BY PRODUCT_CATEGORY
END
Note: The AS_ROOT command is only supported with JOIN syntax as shown above and is not supported for conditional JOIN syntax.
The output of the above syntax is shown below:
