Styling Reports

In this section:

Reference:

A report consists of several components, each of which can you can format or style. WebFOCUS App Studio is installed with a set of StyleSheet files, each of which has a distinctive theme. You can select one of these themes for your output and you can customize selected report components individually. You can create your own styles or use the themes included with WebFOCUS App Studio.

Using a styling theme is an excellent way to easily style many different aspects of a report, for example, headings, footings, column titles, backgrounds, fonts, grids, borders, images, and so on. Many companies apply standard style themes to their reports so all of their reports look consistent and professional.

A style theme, once it is applied to a report, is used every time the report is run. If you want to display some of the data differently, you can customize individual styles either for all data or for data that satisfies specific criteria (called conditional styling).

Styling Characteristics

The physical characteristics of a style for a report component consist of the following basic attributes:

Introducing StyleSheets

How to:

A StyleSheet describes how you want your report to look. You can create a StyleSheet within a report request (useful when you are applying a set of styles to only one report) or as a separate file (useful when you want to create a StyleSheet theme that you can apply to any report). In addition, you can create a StyleSheet on one platform and then port it to, and run it on, other platforms.

You use the Style group, on the Report tab, to apply stylistic changes to a report, including data, title, and all other components of the report. The commands are:

A StyleSheet consists of a set of declarations, which:

In your StyleSheet, you only need to include declarations for those components whose format you want to change. Within each declaration, you only need to include those attributes you want to change.

Each declaration in a StyleSheet consists of attribute=value pairs separated by commas, and terminated with a comma and dollar sign (,$). The syntax is:

TYPE=component, attribute=value, ... ,$

For example:

TYPE=Report, FONT=Times, SIZE=10, $
TYPE=Data, COLUMN=REVENUE_US, BACKCOLOR=Aqua, COLOR=Navy, STYLE=Bold, 
 WHEN=REVENUE_US GT 500, $
TYPE=Title, FONT='Helvetica', $
TYPE=Heading, FONT='Helvetica', STYLE=Bold, SIZE=14, JUSTIFY=Center,
 BACKCOLOR=Dark Turquoise, COLOR=White, $
TYPE=Heading, LINE=6, BACKCOLOR=White, COLOR=Dark  Turquoise,$

Procedure: How to Select a Styling Theme

The following procedure shows you how to change the default style to a predefined theme.

  1. On the Home tab, in the Content group, click Report.

    The Report Wizard opens.

  2. Click Create Report.

    The Select Data Source window opens.

  3. Select the wf_retail.mas data source and click Finish.

    The Report canvas opens.

  4. Select the Full Name, Product Name, and Revenue fields and click Run on the Quick Access toolbar to view the report with no conditional styling.


  5. On the Report tab, in the Style group, click Change Theme.
  6. In the Open File dialog box, click the Legacy Style Templates folder, as shown in the following image.
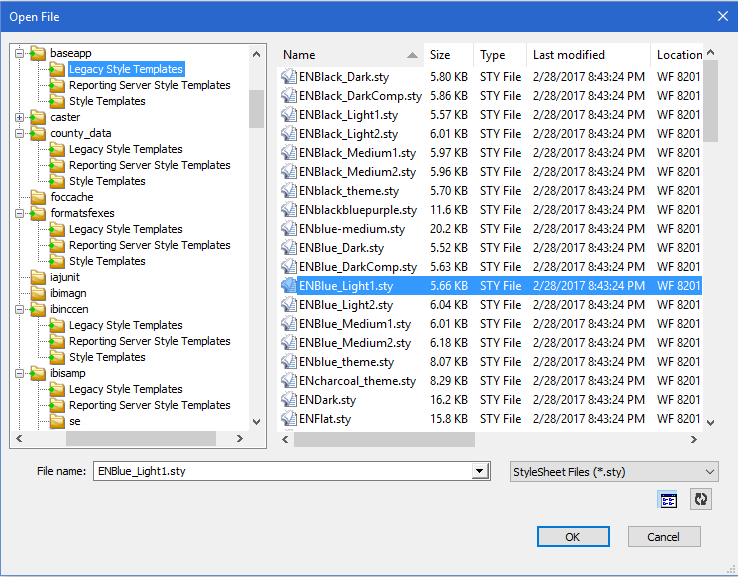
  7. From the list of style files in the right pane, locate and select a template file, for example, ENBlue_Light1.sty. The report styling in the canvas automatically changes, as shown in the following image.


Procedure: How to Apply a Style Theme Using WebFOCUS Syntax

The following request applies the enblue_light1 theme to the report output. The ON TABLE SET STYLE * and ENDSTYLE commands indicate the beginning and the end of an inline StyleSheet.

TABLE FILE WF_RETAIL
SUM REVENUE_US
BY FULLNAME
BY PRODUCT_NAME
ON TABLE SET HTMLCSS ON 
ON TABLE SET STYLE * 
INCLUDE = enblue_light1, 
$
ENDSTYLE
END

Procedure: How to Create a StyleSheet in a Report Request

You can use the following commands in a report request to create a StyleSheet to indicate the beginning and the end of an inline StyleSheet:

ON TABLE SET STYLE *
.
.
.
ENDSTYLE

For example, in the following report request, the StyleSheet syntax appears in bold.

TABLE FILE WF_RETAIL
SUM REVENUE_US BY FULLNAME BY PRODUCT_NAME 
ON TABLE SET STYLE *
TYPE=REPORT, FONT=ARIAL, SIZE=10, $
TYPE=REPORT, COLUMN=REVENUE_US, COLOR=RED, $
TYPE=REPORT, COLUMN=FULLNAME, COLOR=BLUE, $
TYPE=REPORT, COLUMN=PRODUCT_NAME, COLOR=GREEN, $
ENDSTYLE 
END 

The request produces the following report, in which the font for the entire report is Arial 10, the Full Name column is blue, the Product Name column is green, and the Revenue column is red.


Conditionally Styling Components in a StyleSheet

How to:

You can conditionally format report components or display a graphic in your report based on the values in your report. Using conditional styling, you can:

Procedure: How to Apply Conditional Styling with the Traffic Lights Feature

This procedure shows how you can use the Traffic Lights feature to apply styling in your report based on conditions that you define. You can apply the styling either to an entire row, or to column data only. This example will use a red background to highlight revenue column data amounts that are less than 500.

  1. On the Home tab, in the Content group, click Report.

    The Report Wizard opens.

  2. Click Create Report.

    The Report Wizard - Select Procedure Location window opens.

  3. Select a location for your report and click Next.

    The Select Data Source window opens.

  4. Select the wf_retail.mas data source and click Finish.

    The Report canvas opens.

  5. Select the Customer Full Name, Product Name, and Revenue fields, and then click Run on the Quick Access toolbar to view the report with no conditional styling.
  6. Return to the Report canvas to create a condition for the Revenue field, for which you will later specify styling. Click the Revenue field to highlight it.
  7. On the Appearance tab, in the Traffic Lights group, click the drop-down list box and select Add/Edit Conditions.

    Note: The Traffic Lights group in the Appearance tab is used to highlight column data only. To highlight an entire row, use the Traffic Lights group in the Reports tab instead.

    The Condition List dialog box opens.

  8. Click New.

    The Edit Condition dialog box opens. In the Condition field, a default name COND0001 is specified for your new condition, which you can change as required.

  9. Complete the Edit Condition dialog box as shown in the following image.
    • Select Revenue for the field.
    • Select is less than for the Relation.
    • Select Value for the Compare Type.
    • Type 500 for the Value.


  10. Click OK to save your new condition and close the Edit Condition dialog box.

    You are returned to the Condition List dialog box. Notice that the new condition COND0001 is now listed.

  11. Click OK.
  12. Select COND0001 from the Traffic Lights drop-down list box to specify styling for the new condition.
  13. On the Appearance tab, in the Style group, set the background color to red.

    Note that the red background displays as a preview in the Report canvas when COND0001 is selected.

  14. Click Run on the Quick Access toolbar to view the report with conditional styling.
    Note that only the Revenue amounts below 500 appear with the red background, as shown in the following image.


    The example above shows conditional styling applied to the column data only, because the Traffic Lights group in the Appearance tab was used. To highlight the entire row, use the Traffic Lights group in the Reports tab instead.

Procedure: How to Set Conditional Styling Using the WebFOCUS Syntax

This request sets conditional styling to use a red background to highlight revenue amounts that are less than 500.

TABLE FILE WF_RETAIL
SUM REVENUE_US
BY FULLNAME
BY PRODUCT_NAME
ON TABLE SET HTMLCSS ON
ON TABLE SET STYLE *
   INCLUDE = endeflt,$ 
TYPE=DATA, COLUMN=REVENUE_US, WHEN=REVENUE_US LT 500, BACKCOLOR='RED' ,$ 
ENDSTYLE
END

Reference: Styling Report Components

The following chart lists all report components that you can style.

TYPE

Report Component

REPORT

The entire report.

PAGENUM

Default page numbers.

TABHEADING

A heading on the first page of a report.

TABFOOTING

A footing on or after the last page of a report.

HEADING

Headings at the top of each report page.

FOOTING

Footings at the bottom of each report page.

SUBHEAD

Headings before a particular sort field.

SUBFOOT

Footings after a particular sort field.

DATA

Report data.

TITLE

Column titles.

ACROSSTITLE

ACROSS field names (that is, field names used in ACROSS phrases).

ACROSSVALUE

ACROSS field values (that is, values of the ACROSS field).

SUBTOTAL

Totals generated by SUBTOTAL, SUB-TOTAL, RECOMPUTE, and SUMMARIZE.

GRANDTOTAL

The last total on a report, which can either be a column total generated by COLUMN-TOTAL or a grand total generated by SUBTOTAL, SUB- TOTAL, RECOMPUTE, or SUMMARIZE.

RECAP

Lines generated by ON field name RECAP or ON field name COMPUTE.

UNDERLINE

Underlines generated by ON field name UNDER-LINE.

SKIPLINE

Skipped lines generated by ON field name SKIP-LINE.

FREETEXT

FML free text.