Procedure: How to Create a Widget to Autoplay Control Values
- Create an XML parameter report to use for the map. For example:
TABLE FILE BASEAPP/WF_RETAIL_LITE
SUM
WF_RETAIL_LITE.WF_RETAIL_SALES.REVENUE_US
WF_RETAIL_LITE.WF_RETAIL_SALES.GROSS_PROFIT_US
BY WF_RETAIL_LITE.WF_RETAIL_GEOGRAPHY_STORE.COUNTRY_NAME
WHERE WF_RETAIL_LITE.WF_RETAIL_TIME_SALES.TIME_DATE_YEAR_COMPONENT EQ &TIME_DATE_YEAR_COMPONENT.(FIND WF_RETAIL_LITE.WF_RETAIL_TIME_SALES.TIME_DATE_YEAR_COMPONENT,
WF_RETAIL_LITE.WF_RETAIL_TIME_SALES.TIME_DATE_YEAR_COMPONENT IN
baseapp/wf_retail_lite|FORMAT=YYMDy).Sale,Year:.QUOTEDSTRING;
ON TABLE SET PAGE-NUM NOLEAD
ON TABLE SET ASNAMES ON
ON TABLE NOTOTAL
ON TABLE PCHOLD FORMAT XML
ON TABLE SET HTMLCSS ON
END
- Create a new HTML page.
- In the Objects group, click ESRI Map to draw an Esri map component on the canvas.
- From the Requests & Data Sources panel, select the New drop-down arrow, point to External Request, and then click WebFOCUS Procedure.
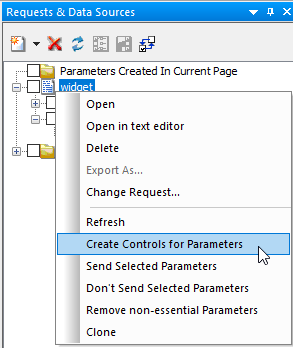
- Right-click the report in the Requests & Data Sources panel and click Create Controls for Parameters, as shown in the following image.
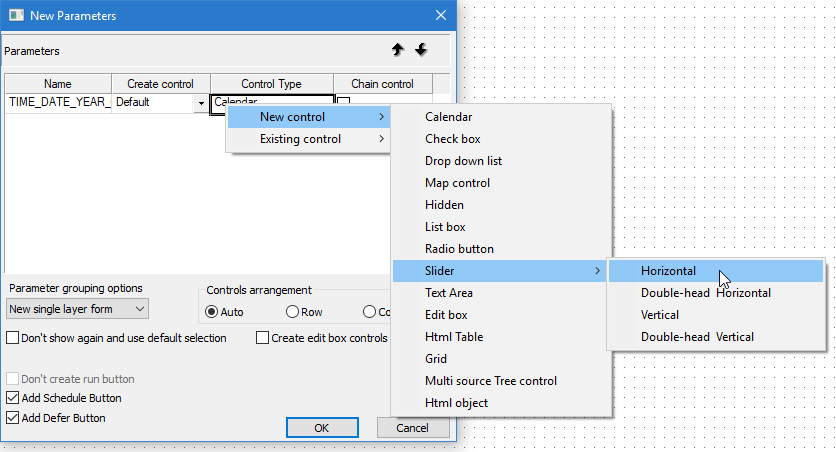
- In the New Parameters dialog box:
- In the Control Type column, right-click Calendar.
- Select New control.
- Select Slider.
- Select Horizontal.
The populated New Parameters dialog box is shown in the following image.
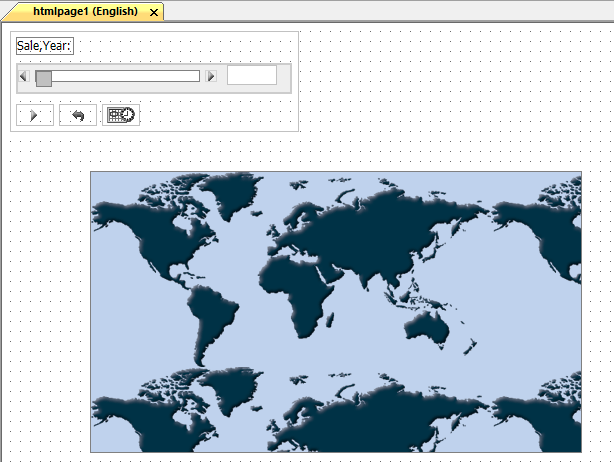
- Click OK.
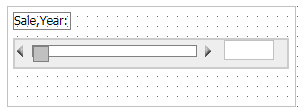
The horizontal slider is added to the HTML page, as shown in the following image.
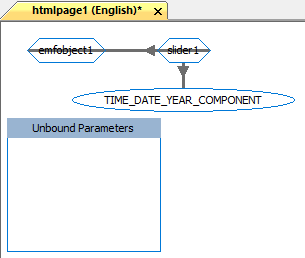
- Select the Parameters tab and drag the slider over emfobject1 (the map object) to draw a line to symbolize the chaining of objects. The arrow indicates
the direction of the chaining, as shown in the following image.
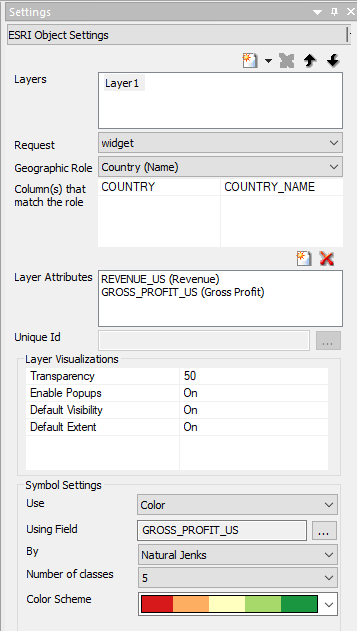
- Return to the Design tab, select the map object, and open the Settings panel.
- On the Settings panel:
- Select Layer1.
- For the Request value, select the name of the XML report.
- For the Geographic Role, select Country (Name).
- For the Column(s) that match the role, select COUNTRY_NAME.
- For the Layer Attributes, select REVENUE_US and GROSS_PROFIT_US.
- For the Enable Popups attribute, select On.
- For the Default Extent attribute, select On.
- For the Use attribute, select Color.
- For the Using Field attribute, select GROSS_PROFIT_US.
- For the Color Scheme attribute, select red to green.
The populated Settings panel is shown in the following image.
- Multi-select the Submit, Reset, and Schedule buttons in the form and delete them, as shown in the following image.
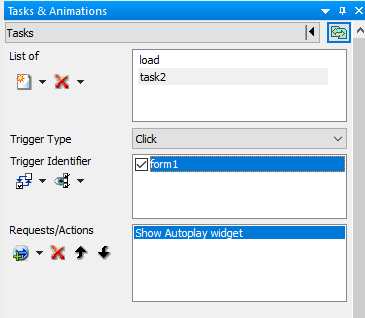
- On the Tasks & Animations panel:
- Delete task 2 and task 3.
- Create a new task.
- For the Trigger Type attribute, select Click.
- Select the form of the control to add the Trigger Identifier.
- Select form1.
- For the Requests/Actions attribute, select Show Autoplay widget.
The populated Tasks & Animations panel is shown in the following image.
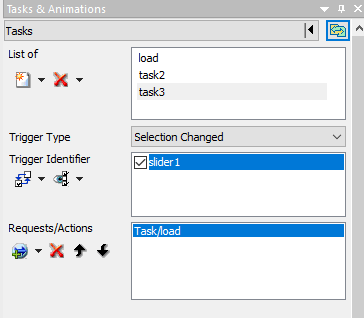
- On the Tasks & Animations panel:
- Create a new task.
- For the Trigger Type attribute, select Selection Changed.
- Select the form of the control to add the Trigger Identifier.
- Select slider1.
- For the Requests/Actions attribute, select Execute Task and then select load.
The populated Tasks & Animations panel is shown in the following image.
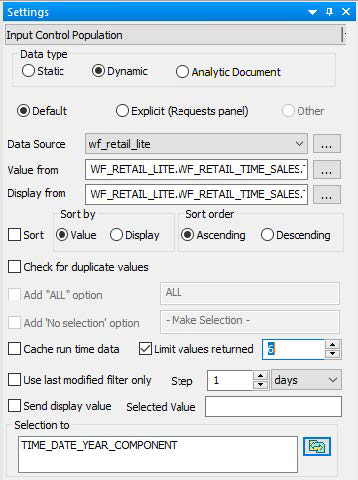
- Select the slider control in the HTML canvas.
- On the Settings panel, select Limit values returned and change the value to 6, as shown in the following image.
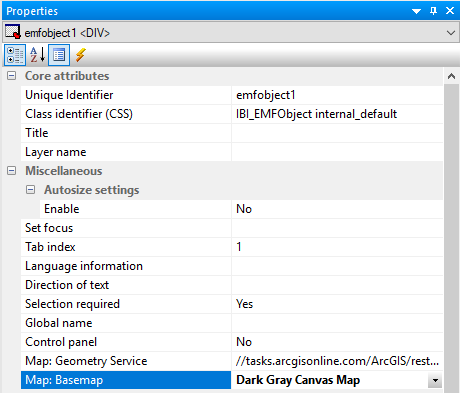
- Select the map component in the HTML canvas.
- From the Properties panel, change Map: Basemap to Dark Gray Canvas Map, as shown in the following image.
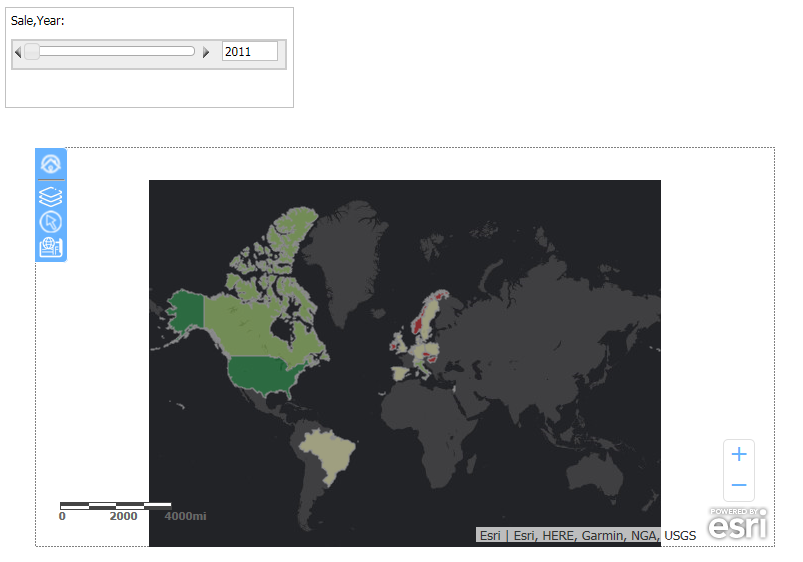
- Run the HTML page, as shown in the following image.
- Click within the slider form.
- Select Sale,Year: from the Autoplay Widget drop-down list, as shown in the following image.
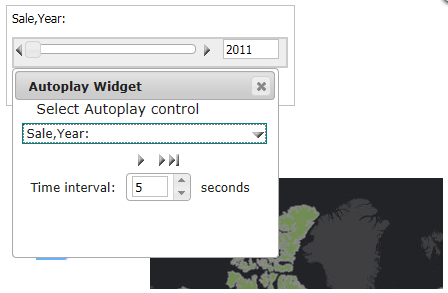
- Drag to reposition the widget, so that it does not cover the map or the control.
- Click the play button.
Note: As the slider moves automatically, from year to year, the map is refreshed with the data for the corresponding year.