Applying Sequential Conditional Formatting
|
How to: |
You can apply sequential conditional logic to a report component by creating a series of declarations, each with a different condition. This is the StyleSheet equivalent of a sequence of nested IF-THEN-ELSE statements. When several conditional declarations specify the same report component (for example, the same column) and evaluate the same field in the condition, they are processed together as a group. For each instance of the report component (for example, for each cell of a column):
- The conditional declarations in the "group" are evaluated, in the order in which they are found in the StyleSheet, until one of the conditions is satisfied. That declaration is then applied to that instance of the report component. The other conditional declarations in the "group," and any non-conditional declarations that specify the same report component and the same attributes, are ignored for that instance.
- If, however, none of the conditional declarations have been satisfied for that instance, then the first unconditional declaration for that report component that specifies the same attribute(s) is applied to that instance.
- Any unconditional declarations for that report component that specify other attributes (that is, attributes that have not already been applied to the instance in Steps 1 or 2) are now applied to the instance.
- The entire process is repeated for the next instance of the report component (for example, for the next cell of the column).
Syntax: How to Conditionally Format, Display, or Link in a StyleSheet
TYPE=type, [subtype,] attributes, WHEN=field1 operator {field2|value},$
or
TYPE=type, [subtype,] attributes, WHEN=FORECAST, $
where:
- type
-
Is the value of the TYPE attribute. You can specify any report component. For details, see Identifying a Report Component in a WebFOCUS StyleSheet.
- subtype
-
Are any additional attributes, such as COLUMN, ACROSS, or ITEM, that are needed to identify the report component to which you are applying the declaration.
- attributes
-
Are the attributes in the StyleSheet declaration that are made conditional by the WHEN attribute. They can include most formatting, graphic images, and hyperlink attributes.
- field1, field2
-
Identifies the report fields that are being compared. Each one can be:
- The name of a display field or vertical or horizontal sort field in a graph or tabular report. ACROSS values can be used as part of the conditional expressions used to define styling attributes for each cell in the table.
- A column reference in a graph or tabular report.
- The name of an embedded field in the heading or footing of a free-form report.
If you wish to use a field that you do not want to display in the report, you can specify the field in the report request, and use the NOPRINT option to prevent the field from being displayed (for example, PRINT fieldname NOPRINT).
To apply a prefix operator to a field in a report, you can:
- Use the same prefix operator in the WHEN attribute. You must refer to the field by name in the WHEN attribute (for example, WHEN=AVE.PRICE GT 300).
- Refer to the field in the WHEN attribute by column position and omit the prefix operator (for example, WHEN=N3 GT 300). This is not supported for the ST. and CT. prefix operators.
- You cannot use compound boolean expressions with the WHEN attribute.
The field cannot be a packed (P) numeric field.
- operator
-
Defines how the condition is satisfied. You can use these relational operators:
EQ where the condition is satisfied if the values on the left and right are equal. If the values being compared are alphanumeric, their case (uppercase, lowercase, or mixed case) must match.
NE where the condition is satisfied if the values on the left and right are not equal.
LT where the condition is satisfied if the value on the left is less than the value on the right.
LE where the condition is satisfied if the value on the left is less than or equal to the value on the right.
GT where the condition is satisfied if the value on the left is greater than the value on the right.
GE where the condition is satisfied if the value on the left is greater than or equal to the value on the right.
- value
-
Is a constant, such as a number, character string, or date. You must enclose non-numeric constants, such as character strings and dates, in single quotation marks.
Although you cannot use functions or operators here to specify the value, you can define a temporary field (COMPUTE or DEFINE) using functions and operators, use the temporary field in the report, and specify it here instead of a constant.
- FORECAST
-
Identifies fields that are generated using the FORECAST command.
Example: Using Sequential Conditional Formatting
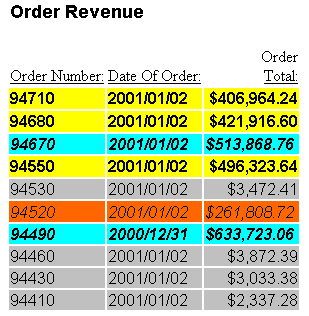
This example illustrates how to apply sequential conditional formatting to a report. This report uses sequential conditional logic to format each row based on its order total (LINEPRICE).
   TABLE FILE CENTORD
   HEADING
   "Order Revenue"
   " "
   SUM ORDER_DATE LINEPRICE AS 'Order,Total:'
   BY HIGHEST 10 ORDER_NUM
   ON TABLE SET PAGE-NUM OFF

   ON TABLE SET STYLESHEET *
   TYPE=REPORT, GRID=OFF, $
1. TYPE=DATA, BACKCOLOR=AQUA, STYLE=BOLD+ITALIC,
   WHEN=LINEPRICE GT 500000, $
2. TYPE=DATA, BACKCOLOR=YELLOW, STYLE=BOLD,
   WHEN=LINEPRICE GT 400000, $
3. TYPE=DATA, BACKCOLOR=ORANGE, STYLE=ITALIC,
   WHEN=LINEPRICE GT 100000, $
4. TYPE=DATA, BACKCOLOR=SILVER, FONT='Arial', $
   TYPE=HEADING, FONT='Arial', STYLE=BOLD, SIZE=11, $
   ENDSTYLE

   END
Notice that:
- The first conditional declaration formats any rows whose order total is greater than 500,000.
- The second conditional declaration formats any rows whose order total is greater than 400,000 and less than or equal to 500,000. This is because rows with an order total greater than 500,000 would have already been formatted by the first conditional declaration.
- The third conditional declaration formats any rows whose order total is greater than 100,000 and less than or equal to 400,000. This is because rows with an order total greater than 400,000 would have already been formatted by one of the first two conditional declarations.
- The unconditional declaration following
the conditional declarations specifies:
- Background color, which is also specified by the conditional declarations. It applies background color (silver) to any rows whose order total is less than or equal to 100,000, since those rows have not already been formatted by the conditional declarations.
- Font, which is not specified by the conditional declarations. It applies font (Arial) to all data rows.
The output is:
Example: Applying Basic Conditional Formatting
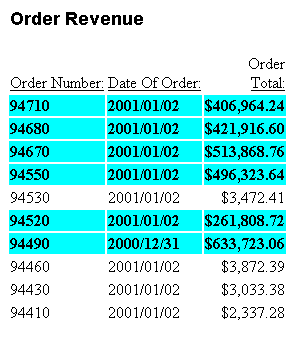
This example illustrates how to apply conditional formatting to a report. The conditional formatting draws attention to orders that total more than 200,000.
Notice that because a particular column is not specified in the declaration, the formatting is applied to the entire row.
TABLE FILE CENTORD
HEADING
"Order Revenue"
" "
SUM ORDER_DATE LINEPRICE AS 'Order,Total:'
BY HIGHEST 10 ORDER_NUM
ON TABLE SET PAGE-NUM OFF

ON TABLE SET STYLESHEET *
TYPE=REPORT, GRID=OFF, $
TYPE=DATA, BACKCOLOR=AQUA, STYLE=BOLD, WHEN=LINEPRICE GT 200000, $
TYPE=HEADING, FONT='Arial', STYLE=BOLD, SIZE=11, $
ENDSTYLE

END
The output is:
Example: Applying Conditional Formatting to a Column
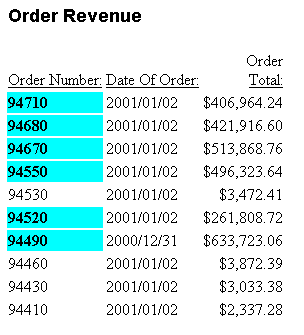
This example illustrates how you can use conditional formatting to draw attention to columns that are not specified in the condition. The WHEN condition states that the order number for orders exceeding 200,000 should display in boldface with an aqua background.
Notice that the column that is evaluated in the WHEN condition (LINEPRICE) is different from the column that is formatted (ORDER_NUM); they do not need to be the same.
TABLE FILE CENTORD
HEADING
"Order Revenue"
" "
SUM ORDER_DATE LINEPRICE AS 'Order,Total:'
BY HIGHEST 10 ORDER_NUM
ON TABLE SET PAGE-NUM OFF

ON TABLE SET STYLESHEET *
TYPE=REPORT, GRID=OFF, $
TYPE=DATA, COLUMN=ORDER_NUM,
   BACKCOLOR=AQUA, STYLE=BOLD, WHEN=LINEPRICE GT 200000, $
TYPE=HEADING, FONT='Arial', STYLE=BOLD, SIZE=11, $
ENDSTYLE

END
The output is:
Example: Conditionally Styling an ACROSS Value
The example below demonstrates how an ACROSS value can be referenced using either the ACROSS field name or the ACROSS column designator (A1, A2).
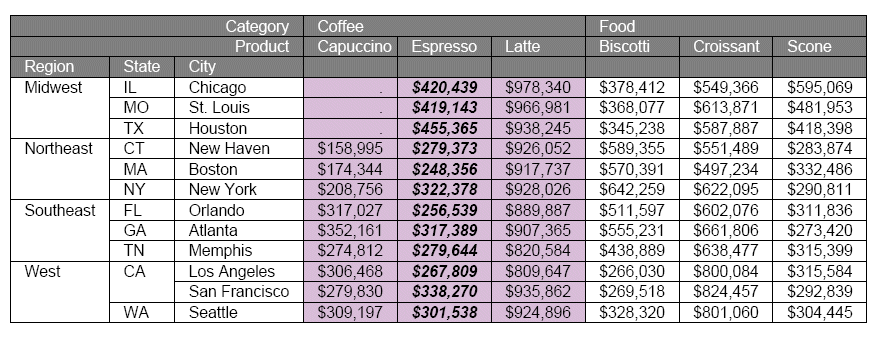
In this example, the ACROSS values are used in conditional styling to set a unique backcolor for all ACROSS columns in the Category Coffee, and additional font styling for the Espresso ACROSS column.
SET ACROSSTITLE=SIDE
TABLE FILE GGSALES
SUM DOLLARS/I8M AS ''
BY REGION
BY ST
BY CITY
ACROSS CATEGORY
ACROSS PRODUCT
WHERE CATEGORY EQ 'Coffee' OR 'Food';
ON TABLE SET PAGE-NUM NOPAGE
ON TABLE NOTOTAL
ON TABLE PCHOLD FORMAT PDF
ON TABLE SET HTMLCSS ON
ON TABLE SET STYLE *
SQUEEZE=ON,UNITS=IN,ORIENTATION=PORTRAIT,$
TYPE=REPORT,FONT='ARIAL',SIZE=10,BORDER=LIGHT,$
TYPE=ACROSSTITLE,COLOR=WHITE, BACKCOLOR=GREY,$
TYPE=ACROSSVALUE,COLOR=WHITE, BACKCOLOR=GREY,$
TYPE=TITLE,COLOR=WHITE, BACKCOLOR=GREY,$
TYPE=DATA, ACROSSCOLUMN=DOLLARS, BACKCOLOR=THISTLE, WHEN=CATEGORY EQ 'Coffee',$
TYPE=DATA, ACROSSCOLUMN=DOLLARS, STYLE=BOLD+ITALIC, WHEN=A2 EQ 'Espresso', $
ENDSTYLE
END
The output is:
Example: Conditionally Formatting a Data Visualization Bar Graph
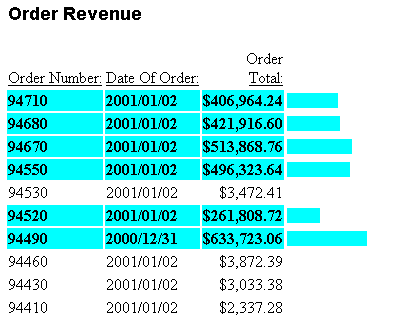
This example illustrates how to apply conditional formatting to a data visualization bar graph. This report request incorporates a data visualization bar chart to graphically represent the data in the LINEPRICE column. It uses conditional formatting to draw attention to orders that total more than 200,000. It conditionally applies that formatting both to the data columns (TYPE=DATA) and to the bar graph (GRAPHTYPE=DATA).
Note that data visualization is only supported for HTML reports.
TABLE FILE CENTORD
HEADING
"Order Revenue"
" "
SUM ORDER_DATE LINEPRICE AS 'Order,Total:'
BY HIGHEST 10 ORDER_NUM
ON TABLE SET PAGE-NUM OFF

ON TABLE SET STYLESHEET *
TYPE=REPORT, GRID=OFF, $
TYPE=DATA, BACKCOLOR=AQUA, STYLE=BOLD, WHEN=LINEPRICE GT 200000, $
GRAPHTYPE=DATA, COLUMN=LINEPRICE, $
GRAPHTYPE=DATA, GRAPHCOLOR=AQUA, WHEN=LINEPRICE GT 200000,$
TYPE=HEADING, FONT='Arial', STYLE=BOLD, SIZE=11, $
ENDSTYLE

END
The output is:
Example: Applying Conditional Formatting Based on Hidden (NOPRINT) Field Values
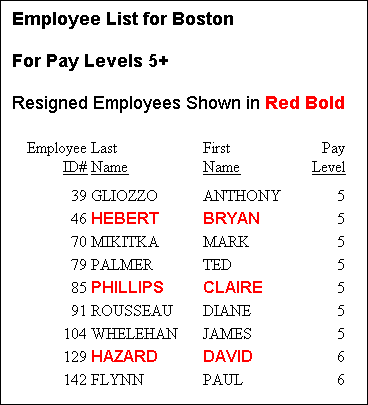
This example illustrates how to apply conditional formatting based on the values of a hidden (NOPRINT) field. This report uses conditional formatting to draw attention to those employees who have resigned.
Notice that the WHEN attribute condition evaluates a field (STATUS) that is hidden in the report. Although the field that is evaluated in the condition must be included in the report request, you can prevent it from displaying in the report by using the NOPRINT option, as shown in the following request.
TABLE FILE CENTHR
HEADING
"Employee List for Boston"
" "
"For Pay Levels 5+"
" "
"Resigned Employees Shown in <0>Red Bold"
" "
PRINT LNAME FNAME PAYSCALE STATUS NOPRINT
BY ID_NUM
WHERE PLANT EQ 'BOS' AND PAYSCALE GE 5
ON TABLE SET PAGE-NUM OFF

ON TABLE SET STYLESHEET *
TYPE=REPORT, GRID=OFF, $
TYPE=DATA, COLUMN=LNAME,
   COLOR=RED, FONT='Arial', STYLE=BOLD, WHEN=STATUS EQ 'RESIGNED', $
TYPE=DATA, COLUMN=FNAME,
   COLOR=RED, FONT='Arial', STYLE=BOLD, WHEN=STATUS EQ 'RESIGNED', $
TYPE=HEADING, FONT='Arial', STYLE=BOLD, SIZE=11, $
TYPE=HEADING, LINE=5, STYLE=-BOLD, $
TYPE=HEADING, LINE=5, ITEM=2, STYLE=BOLD, COLOR=RED, $
ENDSTYLE

END
The output is:
Example: Applying Conditional Formatting to a Sort Group
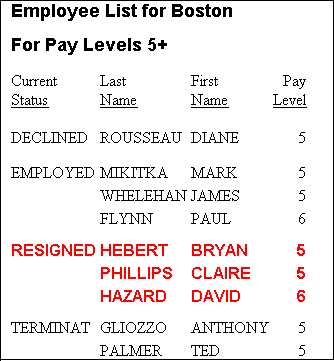
This example illustrates how to apply conditional formatting to a sort group. This report uses conditional formatting to draw attention to those employees who have resigned.
Notice that one conditional declaration can apply formatting to all the sort group rows. You can accomplish this by evaluating the sort field (STATUS) in the WHEN attribute condition.
TABLE FILE CENTHR
HEADING
"Employee List for Boston"
" "
"For Pay Levels 5+"
" "
PRINT LNAME FNAME PAYSCALE
BY STATUS SKIP-LINE
WHERE PLANT EQ 'BOS' AND PAYSCALE GE 5
ON TABLE SET PAGE-NUM OFF

ON TABLE SET STYLESHEET *
TYPE=REPORT, GRID=OFF, $
TYPE=DATA,
   COLOR=RED, FONT='Arial', STYLE=BOLD, WHEN=STATUS EQ 'RESIGNED',$
TYPE=HEADING, FONT='Arial', STYLE=BOLD, SIZE=11, $
ENDSTYLE

END
The output is:
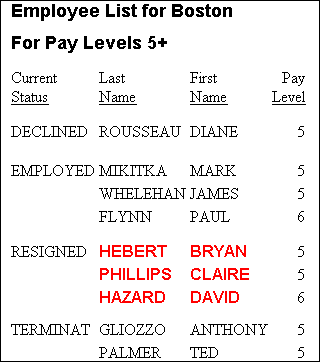
In order to apply the same conditional formatting to only two columns, instead of all the columns, this version of the report request uses two declarations, each specifying a different column (LNAME and FNAME):
TABLE FILE CENTHR
HEADING
"Employee List for Boston"
" "
"Pay Levels 5+"
" "
PRINT LNAME FNAME PAYSCALE
BY STATUS SKIP-LINE
WHERE PLANT EQ 'BOS' AND PAYSCALE GE 5
ON TABLE SET PAGE-NUM OFF

ON TABLE SET STYLESHEET *
TYPE=REPORT, GRID=OFF, $
TYPE=DATA, COLUMN=LNAME,
   COLOR=RED, FONT='Arial', STYLE=BOLD, WHEN=STATUS EQ 'RESIGNED', $
TYPE=DATA, COLUMN=FNAME,
   COLOR=RED, FONT='Arial', STYLE=BOLD, WHEN=STATUS EQ 'RESIGNED', $
TYPE=HEADING, FONT='Arial', STYLE=BOLD, SIZE=11, $
ENDSTYLE

END
The output is:
Example: Applying Conditional Formatting to Forecasted Values
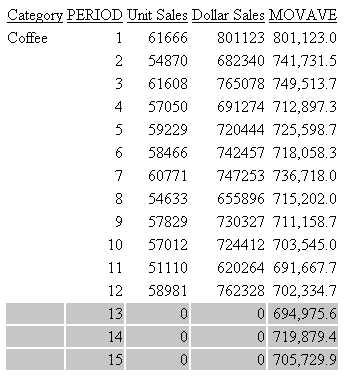
The following illustrates how you can apply conditional formatting to forecasted values in a report.
DEFINE FILE GGSALES
SDATE/YYM = DATE;
SYEAR/Y = SDATE;
SMONTH/M = SDATE;
PERIOD/I2 = SMONTH;
END

TABLE FILE GGSALES
SUM UNITS DOLLARS
BY CATEGORY BY PERIOD
WHERE SYEAR EQ 97 AND CATEGORY EQ 'Coffee'
ON PERIOD RECAP MOVAVE/D10.1= FORECAST(DOLLARS,1,3,'MOVAVE',3);
ON TABLE SET PAGE-NUM OFF
ON TABLE SET STYLE *
TYPE=REPORT, GRID=OFF, $
TYPE=REPORT, BACKCOLOR=SILVER, WHEN=FORECAST, $
ENDSTYLE
END
The output is:
