Syntax: How to Display Missing Values in a Graph
GRAPH FILE filename
.
.
.
SET VZERO={ON|OFF}
ON GRAPH SET STYLE *
*GRAPH_SCRIPT
API call
*END
ENDSTYLE
END
where:
- ON
-
Displays missing values as zero. An API call is not necessary when VZERO is set to ON. Alternatively, you can add ON GRAPH SET VZERO ON.
- OFF
-
Displays missing values as a gap, a dotted line to zero, or, an interpolated dotted line, depending on the API call that is added. Alternatively, you can add ON GRAPH SET VZERO OFF.
- API call
-
Determines how missing values display in the graph when VZERO is set to OFF. Possible values are:
setFillMissingData(0); displays missing values as a gap.
setFillMissingData(1); displays missing values as a dotted line to zero.
setFillMissingData(2); displays missing values as an interpolated dotted line.
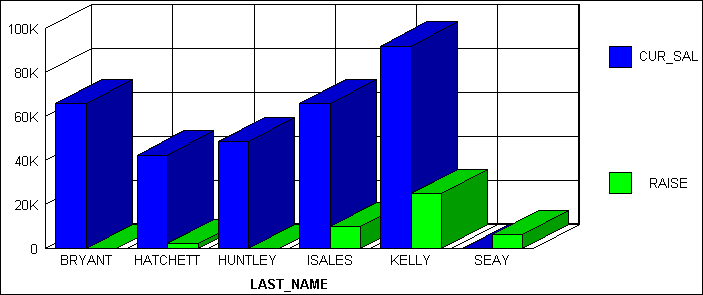
Example: Displaying Missing Values as Zero In a Graph
The following illustrates how missing values are represented in a bar graph when designated to appear as zero. The CURR_SAL value for Seay is missing, as well as the RAISE value for Bryant and Huntley.
SET LOOKGRAPH=BAR
SET GRAPHEDIT=SERVER
SET GRID=ON
SET VZERO=ON
GRAPH FILE MSFATIA
SUM CUR_SAL
RAISE
ACROSS LAST_NAME
ON GRAPH SET STYLE *
*GRAPH_SCRIPT
setTextRotation(getO1Label(),0);
*END
ENDSTYLE
END
The output is:

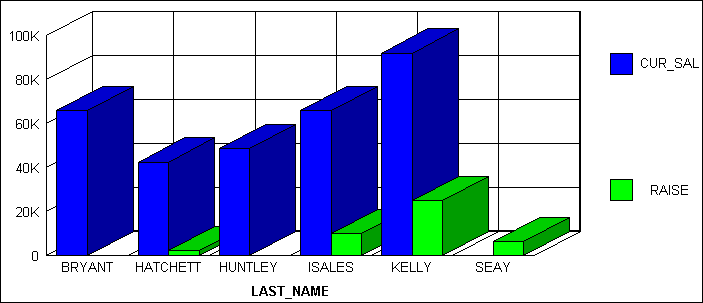
Example: Displaying Missing Values as a Gap
The following illustrates how missing values are represented in a bar graph when designated to appear as a gap. The CURR_SAL value for Seay is missing, as well as the RAISE value for Bryant and Huntley.
SET LOOKGRAPH=BAR
SET GRAPHEDIT=SERVER
SET GRID=ON
SET VZERO=OFF
GRAPH FILE MSFATIA
SUM CUR_SAL
RAISE
ACROSS LAST_NAME
ON GRAPH SET STYLE *
*GRAPH_SCRIPT
setFillMissingData(0);
setTextRotation(getO1Label(),0);
*END
ENDSTYLE
END
The output is:

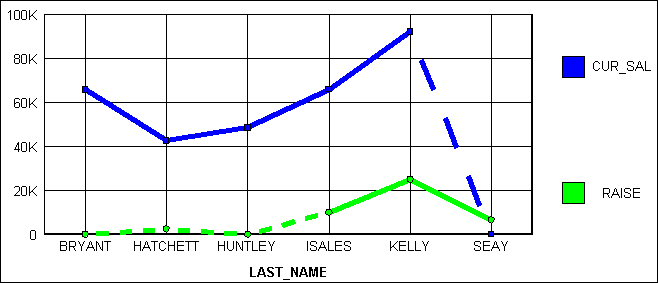
Example: Displaying Missing Values as a Dotted Line to Zero
The following illustrates how missing values are represented in a line graph when designated to appear as a dotted line to zero. The CURR_SAL value for Seay is missing, as well as the RAISE value for Bryant and Huntley.
SET LOOKGRAPH=LINE
SET GRAPHEDIT=SERVER
SET GRID=ON
SET VZERO=OFF
GRAPH FILE MSFATIA
SUM CUR_SAL
RAISE
ACROSS LAST_NAME
ON GRAPH SET STYLE *
*GRAPH_SCRIPT
setFillMissingData(1);
setTextRotation(getO1Label(),0);
*END
ENDSTYLE
END
The output is:

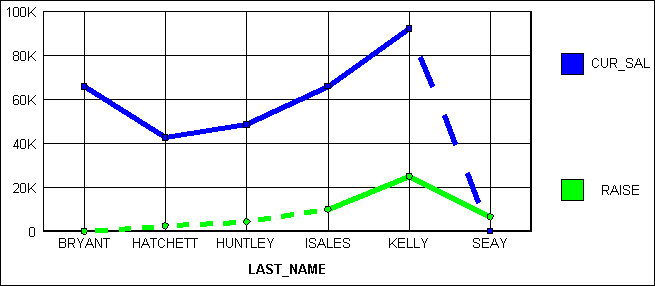
Example: Displaying Missing Values as an Interpolated Dotted Line
The following illustrates how missing values are represented in a line graph when designated to appear as an interpolated dotted line. The CURR_SAL value for Seay is missing, as well as the RAISE value for Bryant and Huntley.
SET LOOKGRAPH=LINE
SET GRAPHEDIT=SERVER
SET GRID=ON
SET VZERO=OFF
GRAPH FILE MSFATIA
SUM CUR_SAL
RAISE
ACROSS LAST_NAME
ON GRAPH SET STYLE *
*GRAPH_SCRIPT
setFillMissingData(2);
setTextRotation(getO1Label(),0);
*END
ENDSTYLE
END
The output is:
