Syntax: How to Apply Conditional Styling to a Graph
TYPE=DATA,[COLUMN|ACROSSCOLUMN=Nn,]COLOR=color, [WHEN=expression,]$
where:
- DATA
-
Identifies data as the graph component to which color is being applied. This value must appear at the beginning of the declaration.
- COLUMN|ACROSSCOLUMN
-
Is the graph subcomponent to which you want to apply color. Valid graph subcomponents are COLUMN and ACROSSCOLUMN.
- Nn
-
Identifies a column by its position in the report. To determine this value, count BY fields, display fields, and ROW-TOTAL fields, from left to right, including NOPRINT fields. For details, see Identifying a Report Component in a WebFOCUS StyleSheet.
- color
-
Identifies the color that you want to apply to the graph component or subcomponent. For a list of valid colors, see Formatting Report Data.
- expression
-
Is any Boolean expression that specifies conditions for applying the specified color to the graph component. The expression must be valid on the right side of a COMPUTE command. For details, see Using Expressions.
Note: IF... THEN ... ELSE logic is not necessary in a WHEN clause and is not supported.
All non-numeric literals in a WHEN expression must be specified within single quotation marks.
Example: Applying Conditional Styling to a Graph
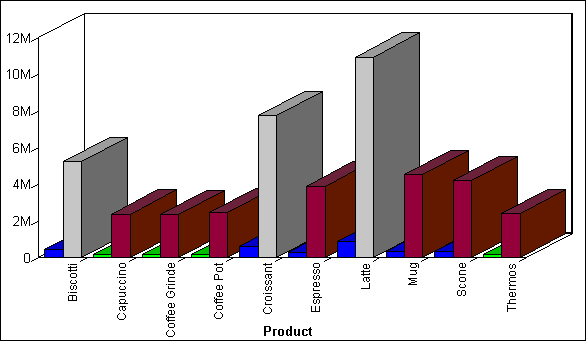
The following illustrates how you can apply conditional styling to a graph.
   GRAPH FILE GGSALES
   SUM UNITS DOLLARS ACROSS PRODUCT
   ON GRAPH SET STYLE *
1. TYPE=DATA,COLOR=BLUE,$
2. TYPE=DATA,ACROSSCOLUMN=N2,COLOR=FIREBRICK,$
3. TYPE=DATA,ACROSSCOLUMN=N2,COLOR=SILVER,WHEN=N2 GT 5000000,$
4. TYPE=DATA,ACROSSCOLUMN=N1,COLOR=LIME,WHEN=N1 LT 200000,$
   ENDSTYLE
   END
- This line specifies blue as the default data color.
- This line specifies firebrick as the default color for the DOLLARS column.
- This line specifies silver as the color for the DOLLARS column when the value for DOLLARS is greater than five million.
- This line specifies lime as the UNITS column color when the number of UNITS is less than two hundred thousand.
The output is:
