|
In this section: |
Adding labels to your graph helps provide important information about what the data in your graph represents. You may choose to add headings and/or footings to your graph, as well as horizontal (X) and vertical (Y) axis labels.
You can add a heading or footing to your graph using the HEADING or FOOTING phrase. The syntax is the same as that used for headings and footings in TABLE requests. You can also embed field values in graph headings and footings. This capability is particularly useful for annotating graphs that contain multiple sort fields.
For details on headings, footings, and embedded fields, see Using Headings, Footings, Titles, and Labels.
Note: If your graph labels or legends are not appearing correctly when you run your graph, see How to Change Color Settings for details on correcting this.
Example: Adding a Heading and Footing to a Graph
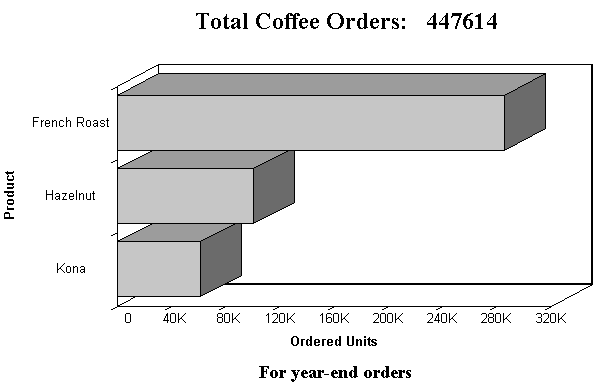
The following illustrates how to add a heading with an embedded field value to your graph. In this example, the heading is "Total Coffee Orders" with the embedded field TOT.QUANTITY.
GRAPH FILE GGORDER
HEADING CENTER
"Total Coffee Orders: <TOT.QUANTITY "
SUM QUANTITY
BY PRODUCT_DESC
WHERE PRODUCT_DESC EQ 'French Roast' OR 'Hazelnut' OR 'Kona'
FOOTING CENTER
"For year-end orders"
END
The output is:
