Syntax: How to Calculate a Simple Moving Average Column
FORECAST_MOVAVE(display, infield, interval,
 npredict, npoint1)
where:
- display
-
Keyword
Specifies which values to display for rows of output that represent existing data. Valid values are:
- INPUT_FIELD. This displays the original field values for rows that represent existing data.
- MODEL_DATA. This displays the calculated values for rows that represent existing data.
Note: You can show both types of output for any field by creating two independent COMPUTE commands in the same request, each with a different display option.
- infield
- Is any numeric field. It can be the same field as the result field, or a different field. It cannot be a date-time field or a numeric field with date display options.
- interval
- Is the increment to add to each sort field value (after
the last data point) to create the next value. This must be a positive
integer. To sort in descending order, use the BY HIGHEST phrase.
The result of adding this number to the sort field values
is converted to the same format as the sort field.
For date fields, the minimal component in the format determines how the number is interpreted. For example, if the format is YMD, MDY, or DMY, an interval value of 2 is interpreted as meaning two days. If the format is YM, the 2 is interpreted as meaning two months.
- npredict
- Is the number of predictions for FORECAST to calculate. It must be an integer greater than or equal to zero. Zero indicates that you do not want predictions, and is only supported with a non-recursive FORECAST.
- npoint1
- Is the number of values to average for the MOVAVE method.
Example: Calculating a New Simple Moving Average Column
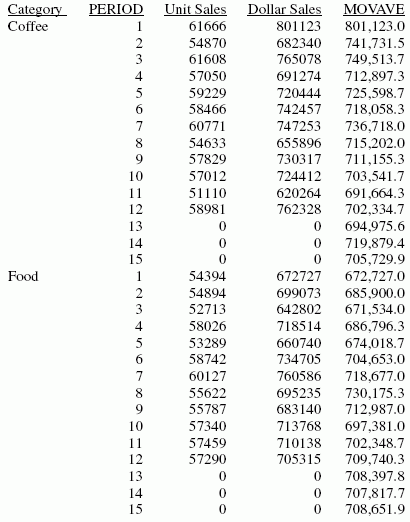
This request defines an integer value named PERIOD to use as the independent variable for the moving average. It predicts three periods of values beyond the range of the retrieved data. The MOVAVE column on the report output shows the calculated moving average numbers for existing data points.
DEFINE FILE GGSALES
SDATE/YYM = DATE;
SYEAR/Y = SDATE;
SMONTH/M = SDATE;
PERIOD/I2 = SMONTH;
END
TABLE FILE GGSALES
SUM UNITS DOLLARS
COMPUTE  MOVAVE/D10.1= FORECAST_MOVAVE(MODEL_DATA, DOLLARS,1,3,3);
BY CATEGORY BY PERIOD
WHERE SYEAR EQ 97 AND CATEGORY NE 'Gifts'
ON TABLE SET STYLE *
GRID=OFF,$
ENDSTYLE
END
The output is:

In the report, the number of values to use in the average is 3 and there are no UNITS or DOLLARS values for the generated PERIOD values.
Each average (MOVAVE value) is computed using DOLLARS values where they exist. The calculation of the moving average begins in the following way:
- The first MOVAVE value (801,123.0) is equal to the first DOLLARS value.
- The second MOVAVE value (741,731.5) is the mean of DOLLARS values one and two: (801,123 + 682,340) /2.
- The third MOVAVE value (749,513.7) is the mean of DOLLARS values one through three: (801,123 + 682,340 + 765,078) / 3.
- The fourth MOVAVE value (712,897.3) is the mean of DOLLARS values two through four: (682,340 + 765,078 + 691,274) /3.
For predicted values beyond the supplied values, the calculated MOVAVE values are used as new data points to continue the moving average. The predicted MOVAVE values (starting with 694,975.6 for PERIOD 13) are calculated using the previous MOVAVE values as new data points. For example, the first predicted value (694,975.6) is the average of the data points from periods 11 and 12 (620,264 and 762,328) and the moving average for period 12 (702,334.7). The calculation is: 694,975 = (620,264 + 762,328 + 702,334.7)/3.
Example: Displaying Original Field Values in a Simple Moving Average Column
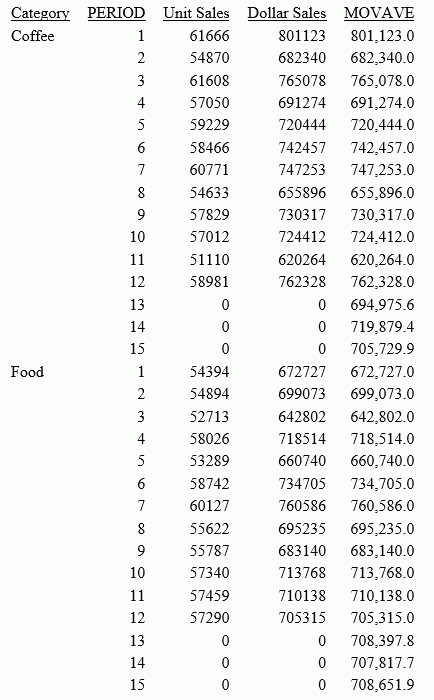
This request defines an integer value named PERIOD to use as the independent variable for the moving average. It predicts three periods of values beyond the range of the retrieved data. It uses the keyword INPUT_FIELD as the first argument in the FORECAST parameter list. The trend values do not display in the report. The actual data values for DOLLARS are followed by the predicted values in the report column.
DEFINE FILE GGSALES
SDATE/YYM = DATE;
SYEAR/Y = SDATE;
SMONTH/M = SDATE;
PERIOD/I2 = SMONTH;
END
TABLE FILE GGSALES
SUM UNITS DOLLARS
COMPUTE MOVAVE/D10.1 = FORECAST_MOVAVE(INPUT_FIELD,DOLLARS,1,3,3);
BY CATEGORY BY PERIOD
WHERE SYEAR EQ 97 AND CATEGORY NE 'Gifts'
ON TABLE SET STYLE *
GRID=OFF,$
ENDSTYLE
END
The output is shown in the following image:
