Multivariate Quality Control Computational Details
Hotellings T2 for Individuals.
S is the successive difference estimator or the sample covariance matrix as you specify.
Upper Control Limit (UCL) - Phase 1:
where,
m = number of observations p = number of variables
If the sample covariance matrix is used, f = m in the above equation.
UCL - Phase 2:

where,
m = number of observations used to estimate the covariance matrix p = number of variables
Hotellings T2 for Subgroups
UCL - Phase 1:
where,
n = size of individual sample m = number of samples p = number of variables
UCL - Phase 2:
where,
n = size of individual sample m = number of samples used to estimate covariance matrix p = number of variables
Decomposed Hotellings T2
You can use this measure to assess the contribution of an individual variable to the overall T2.
where
![]() is the Hotellings T2 holding out the ith variable.
is the Hotellings T2 holding out the ith variable.
Generalized Variance Statistic:
The generalized variance statistic is the determinant of the of the covariance matrix of the ith subgroup. The generalized variance statistic is not defined in the case of an individuals chart.
UCL:
Center Line:
The center line is the determinant of the sample covariance matrix.
Lower Control Limit (LCL):

MEWMA Chart:
where,
xi is the ith vector of means and lambda is a constant between 0 and 1.
where,
When the sample size is 1, Sigma is estimated using the successive differences estimator. For more details on control limits for MEWMA charts, see K.M. Bodden and S.E. Rigdon (1999) A program for Approximating the In-Control ARL for the MEWMA Chart, Journal of Quality Technology.
Cumulative Sum Charts (CUSUM) for Individuals:
CUSUM for individuals is based on the MC1 statistic as defined by Pignatiello and Runger (1990). The MC1 statistic at time t is defined as follows:
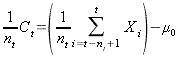
where,
nt = number of observations until the last most recent zero value k = 0.5
Sigma is estimated using the successive differences estimator. Control limits are based on Monte Carlo simulations. For more details, see see Pignatiello, Joseph J., Jr. and George C. Runger, A Comparison of Some Multivariate CUSUM Schemes, Journal of Quality Technology.
Estimation of Variance-Covariance Matrix for Individuals (Successive Differences Estimator):
Estimation of Variance-Covariance Matrix for Subgroups:

where,

This is the average across m sample of the variance of the jth variable.
This is the average across m samples of the covariance between the ith and jth variable.
Multiple Stream Charts:
A Multiple Stream Process (MSP) is a process that yields data from several sources or channels. When the process is in control, the streams of data are identical. Process streams can be operators, machines, or assembly lines. They can also be different characteristics measured on the same part, for example, height, width, depth. The minimum and maximum values of each stream are plotted. Averages, ranges, and standard deviations are simply averaged over all streams and samples. Corresponding control limits are then computed in the same manner as the univariate charts based on these grand averages.