Nonlinear Estimation Evaluating the Fit of the Model - Plot of the Fitted Function
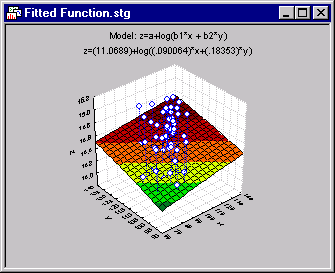
For models involving two or three variables (one or two predictors) it is useful to plot the fitted function using the final parameter estimates. Here is an example of a 3D plot with two predictor variables:
Copyright © 1995-2020 TIBCO Software Inc. All rights reserved.

