Common Types of Multivariate Control Charts
Multiple Data Streams from Identical Processes: Multiple Stream or Group Charts.
A special case of multivariate control charting occurs when there are multiple data streams from identical independent processes. For example, a manufacturer runs multiple identical production lines with identical machines. In this case, the data can be considered as multiple independent data streams. Special quality control charts can be constructed to monitor the extremes across multiple streams. When a particular stream is responsible for a large number of consecutively observed extreme values across all the streams, then it is likely that a quality problem has occurred or is developing with the respective process associated with that data stream.
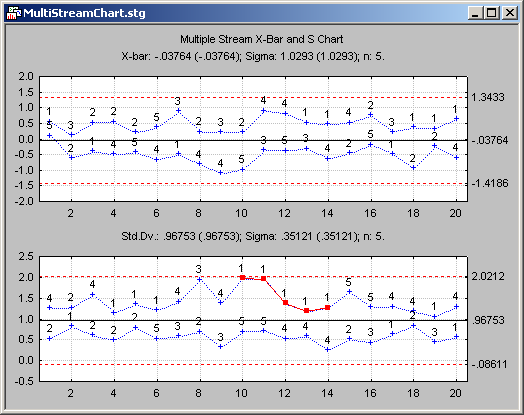
You can create multiple stream charts by overlaying the extreme plot points across data streams from standard univariate X, X-Bar, Range (R), Moving Range (MR), or Standard deviation (S) charts. The information contains runs of consecutive extreme values like standard deviations, or ranges observed from a particular process. This information is displayed on multiple stream charts and can be easily translated into actionable information that helps to determine which specific process and data stream are responsible for an unexpectedly large number of extreme values.
Hotelling T2 Chart; Generalized Variance Chart
The multivariate equivalents of X, X-bar, and S charts are the Hotelling T2 chart and Generalized Variance chart. Instead of controlling single X values or means, and standard deviations, the Hotelling T2 chart allows for the control of a vector of means for multiple characteristics, and the variance or covariance matrix of the variables to control process variability.

You can use these charts to simultaneously monitor tens of variables in a single chart. When an out-of-control sample is detected, you can create a follow-up Pareto (-like) chart to identify the variables responsible for the alarm. These variables can then be further examined in standard X, X-bar, S, R, or MR charts.
Detecting changes in multivariate space
The Hotelling T2 is a distance chart, and the plotted points (T2) indicate the distance of mean vectors (samples) from the center point (vector of centerline values, or means) in multivariate space. The Hotelling T2 chart can detect small movements or drifts in multivariate space that cannot be picked up at an earlier stage using simple univariate control charting. For more details, see General Approach. Hence, Hotelling T2 charts can provide a more sensitive and powerful control method for large numbers of variables, detecting even small shifts or drift that simultaneously affect the variables.
MEWMA Charts
The MEWMA Chart is a multivariate generalization of the univariate Exponentially Weighted Moving Average (EWMA) chart. For more details, see Lowry, Woodall, Champ, and Rigdon. The chart is constructed from vectors of multiple exponentially weighted moving averages instead of tracking the exponentially weighted moving average for a single variable. For more information see, Quality Control. The test statistic computed for the plot points on the chart is also the Hotelling T2 statistic.
Control limits and Average Run (AR)
The control limits for the MEWMA are usually chosen based on the expected Average Run Length (ARL). Specifically, the ARL is the expected average number of samples that are observed during continuous operation, with data from a constant multivariate and in-control-process, before an erroneous out-of-control condition occurs (given the respective value of T2). Thus, 1/ARL can be interpreted as an expected false alarm rate, not unlike the false-alarm probabilities associated with control limits in standard univariate Shewhart control charts. The computations of the control limits from a user-specified ARL are performed using an algorithm proposed by Molnau, Runger, Montgomery, Skinner, Loredo, and Prabhu.
MCUSUM Charts
The MCUSUM chart is a generalization of the univariate CUSUM chart. In this chart, a single statistic is charted that tracks the multivariate cumulative sum of deviations of individual points from a vector of means or a multivariate standard. The specific chart computations follow the computations described in Pignatiello and Runger as MC1.
Control limits and ARL
The control limits are chosen based on the expected ARL. Specifically, the ARL is the expected average number of samples that are observed during continuous operation, with data from a constant multivariate and in-control-process, before an erroneous out-of-control condition occurs (given the respective control limit for the multivariate CUSUM). Thus, 1/ARL can be interpreted as an expected false alarm rate, not unlike the false-alarm probabilities associated with control limits in standard univariate Shewhart control charts. The value of the multivariate CUSUM control limit value, associated with a specific ARL, is computed via Monte Carlo simulation, as described in Pignatiello and Runger.