Graphical Representations of Multi-way Tables
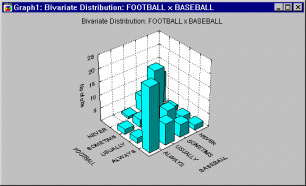
As with all analyses in Statistica, there are numerous graphics options available to aid in the interpretation of tables. You can produce "double categorized" histograms, 3D histograms,
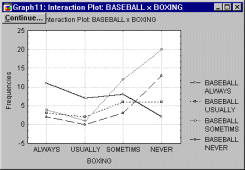
or line plots that will summarize the frequencies for up to 3 factors in a single graph.
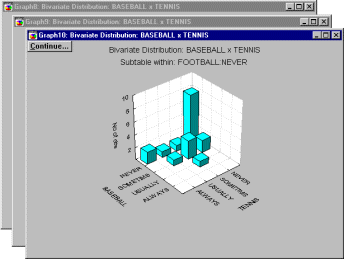
Batches (cascades) of graphs can be used to summarize higher-way tables (as shown in the following graph).
Copyright © 1995-2020 TIBCO Software Inc. All rights reserved.


