General Computation Issues and Unique Solutions of STATISTICA GCHAID
The basic computational algorithm for constructing trees for classification or prediction via CHAID are described in Basic Tree-Building Algorithm: CHAID and Exhaustive CHAID. The implementation of this algorithm in STATISTICA is very comprehensive, and includes various options for determining the merging of categories, options for cross-validation, etc. Also, like the implementation of General Classification and Regression Trees (GC&RT), this module not only supports the standard method of treating continuous and categorical predictors for tree building, but also provides the option to combine the predictors into ANCOVA-like predictor designs, compatible with those that can be specified for GLM, GRM, GLZ, GDA, PLS, GC&RT, etc. See also the description of GC&RT General Computations Issues and Unique Solutions for details in Introductory Overview - Basic Ideas Part II.
Reviewing large trees: Unique analysis management tools. A general issue that arises when applying tree classification or regression methods is that the final trees can become very large. In practice, when the input data are complex and, for example, contain many different categories for classification problems, and many possible predictors for performing the classification, then the resulting trees can become very large. This is not so much a computational problem as it is a problem of presenting the trees in a manner that is easily accessible to the data analyst, or for presentation to the "consumers" of the research.
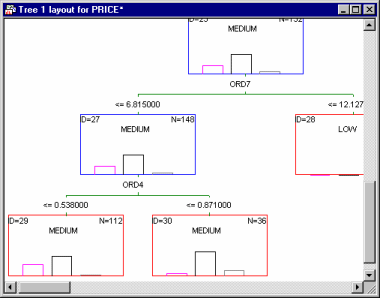
STATISTICA offers three ways in which complex trees can be reviewed. First, like all graphs in STATISTICA, the tree chart summarizing the final solution (tree) can be "navigated" using the standard zooming tools. So, for example, you can quickly zoom in to an area of a larger tree that is of particular interest and use the zoom pan button to move around the graph (see also Navigating (Zooming On) the Summary Tree).
- Point-and-click tools for tree graphs
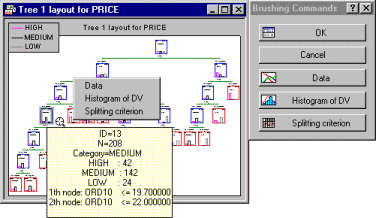
- You can also click the Brush tree button on the Summary tab of the Results dialog and use the cross-hair tool
 to select individual nodes of the tree. As you move the crosshair over a node in the tree, a ToolTip will pop up to display summary statistics for that node.
Click on a node to select (highlight) it, and then choose any of the options from the floating ("brushing") toolbar or the shortcut menu for that node.
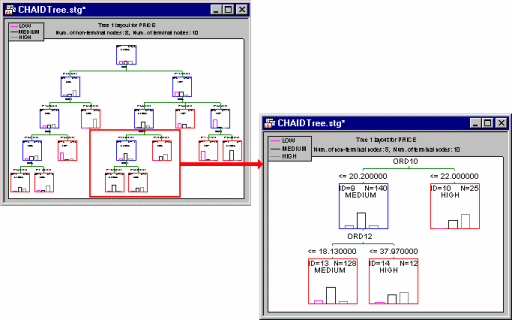
- Scrollable tree window
- You can also display the summary tree graph in a scrollable window.
In a sense, this method allows you to move a (resizable) window over a much larger tree graph.
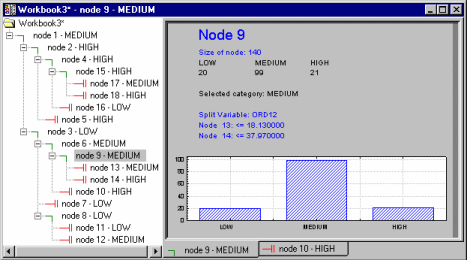
- Tree browser
- However, the most convenient way (and most standard way, from the user-interface point of view) to review information in trees is via the tree browser. In STATISTICA GCHAID (as well as GC&RT), the final tree can be reviewed in an efficient Workbook Tree Browser.
This tree browser is described in the context of GC&RT, in Reviewing large trees: Unique analysis management tools.
- Analyzing ANCOVA-like designs
- The classic CHAID algorithms can accommodate both continuous and categorical predictor variables (see also Basic Tree-Building Algorithm: CHAID and Exhaustive CHAID). However, in practice, it is not uncommon to combine such variables into analysis of variance/covariance (ANCOVA) like predictor designs with main effects or interaction effects for categorical and continuous predictors. This method of analyzing coded ANCOVA-like designs is relatively new, and to date only available in STATISTICA GCHAID as well as GC&RT. However, it is easy to see how the use of coded predictor designs expands these powerful classification and regression techniques to the analysis of data from experimental designs (e.g., see for example the detailed discussion of experimental design methods for quality improvement in the Experimental Design module).
Note: the user interface and methods for specifying designs in GCHAID are identical to those used in GLM, GRM, GLZ, GDA, PLS, and GC&RT (a comprehensive description of the analysis syntax for specifying ANOVA/ANCOVA-like designs is presented in the context of GLM). Hence, a great advantage of this method for analyzing data is that identical predictor designs can be applied using these very different methods for analyzing regression-type problems (e.g., via General Linear Models (GLM), various Generalized Linear Models (GLZ), Partial Least Squares (PLS) methods, or General Classification and Regression Trees (GC&RT)) or classification-type problems (e.g., via General Classification and Regression Trees (GC&RT), General Discriminant Analysis (GDA) models, or applicable Generalized Linear Models (GLZ)).Note: there are four different types of tree-building algorithms available in STATISTICA: CHAID (Kass (1980; see General CHAID Introductory Overview), C&RT (Breiman, Friedman, Olshen, and Stone, 1984; see General Classification and Regression Trees), and QUEST (Loh and Shih, 1997; see Classification Trees Analysis); see also CHAID, C&RT, and QUEST for additional details.