Adding Rules
|
In this section: |
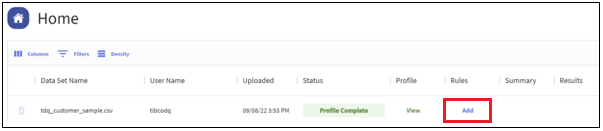
To add (assign) rules when analyzing data:
- Click Add under Rules, as shown in the following image.
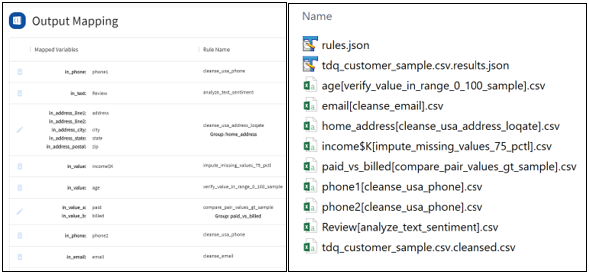
- In the left pane of the mapping window, click the plus (+) icon next to an input data variable (for example, income$K), as
shown in the following image.
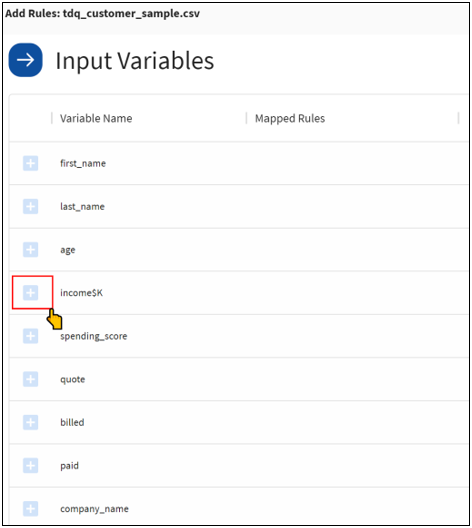
The Select Rule dialog opens, as shown in the following image.
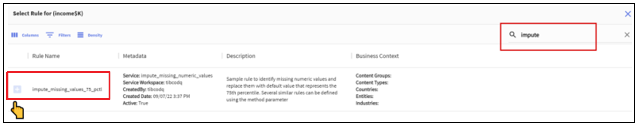
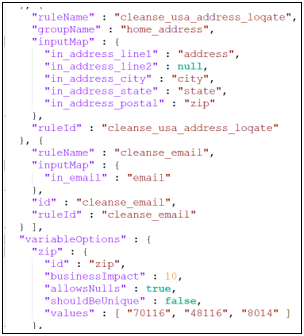
- Search the Rules Catalog and select the most appropriate rule.
- Map input data variables to the rule input.
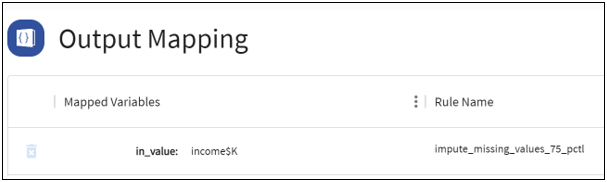
Single Variable Rules
These rules need one input and once selected, the input data variable is automatically mapped to the rule input (for example, income$K).
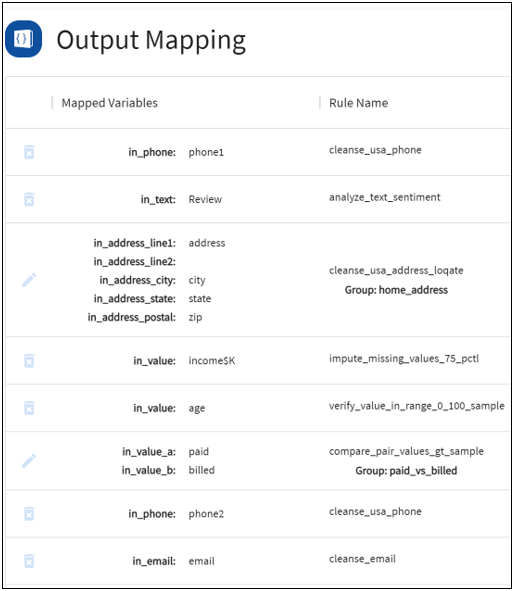
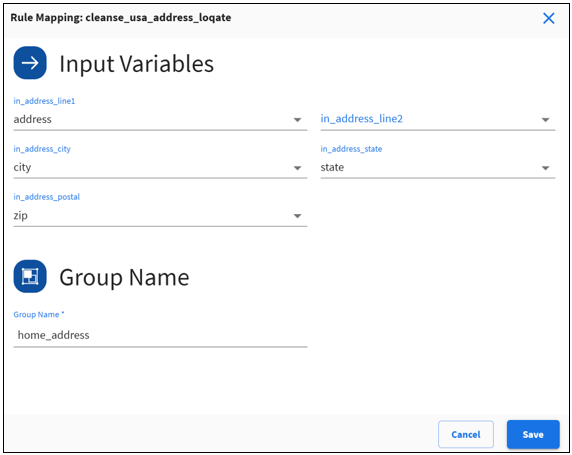
Multi-Variable Rules
These rules require multiple inputs.
- Map each rule input to an input variable.
- Provide a meaningful group name.
Note: The group name is used to generate the output results file name, so make sure you provide a unique group name.
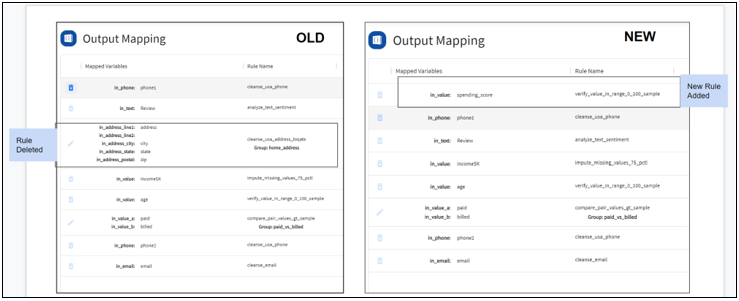
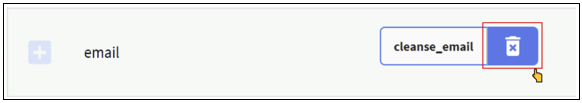
Preassigned Rules
Some columns may have a preassigned rule based on the data class discovered by the profiler. You can delete and reassign a different rule if the assigned rule is not appropriate for the input variable.
Verify all the rules associated with the input variables before submitting the data for processing.