Viewing Collected Statistics
You can view process statistics through the command line, or the Admin UI.
Prerequisites
Admin UI
For details about how to view application, process, and activity data from the Admin UI, see the following sections.
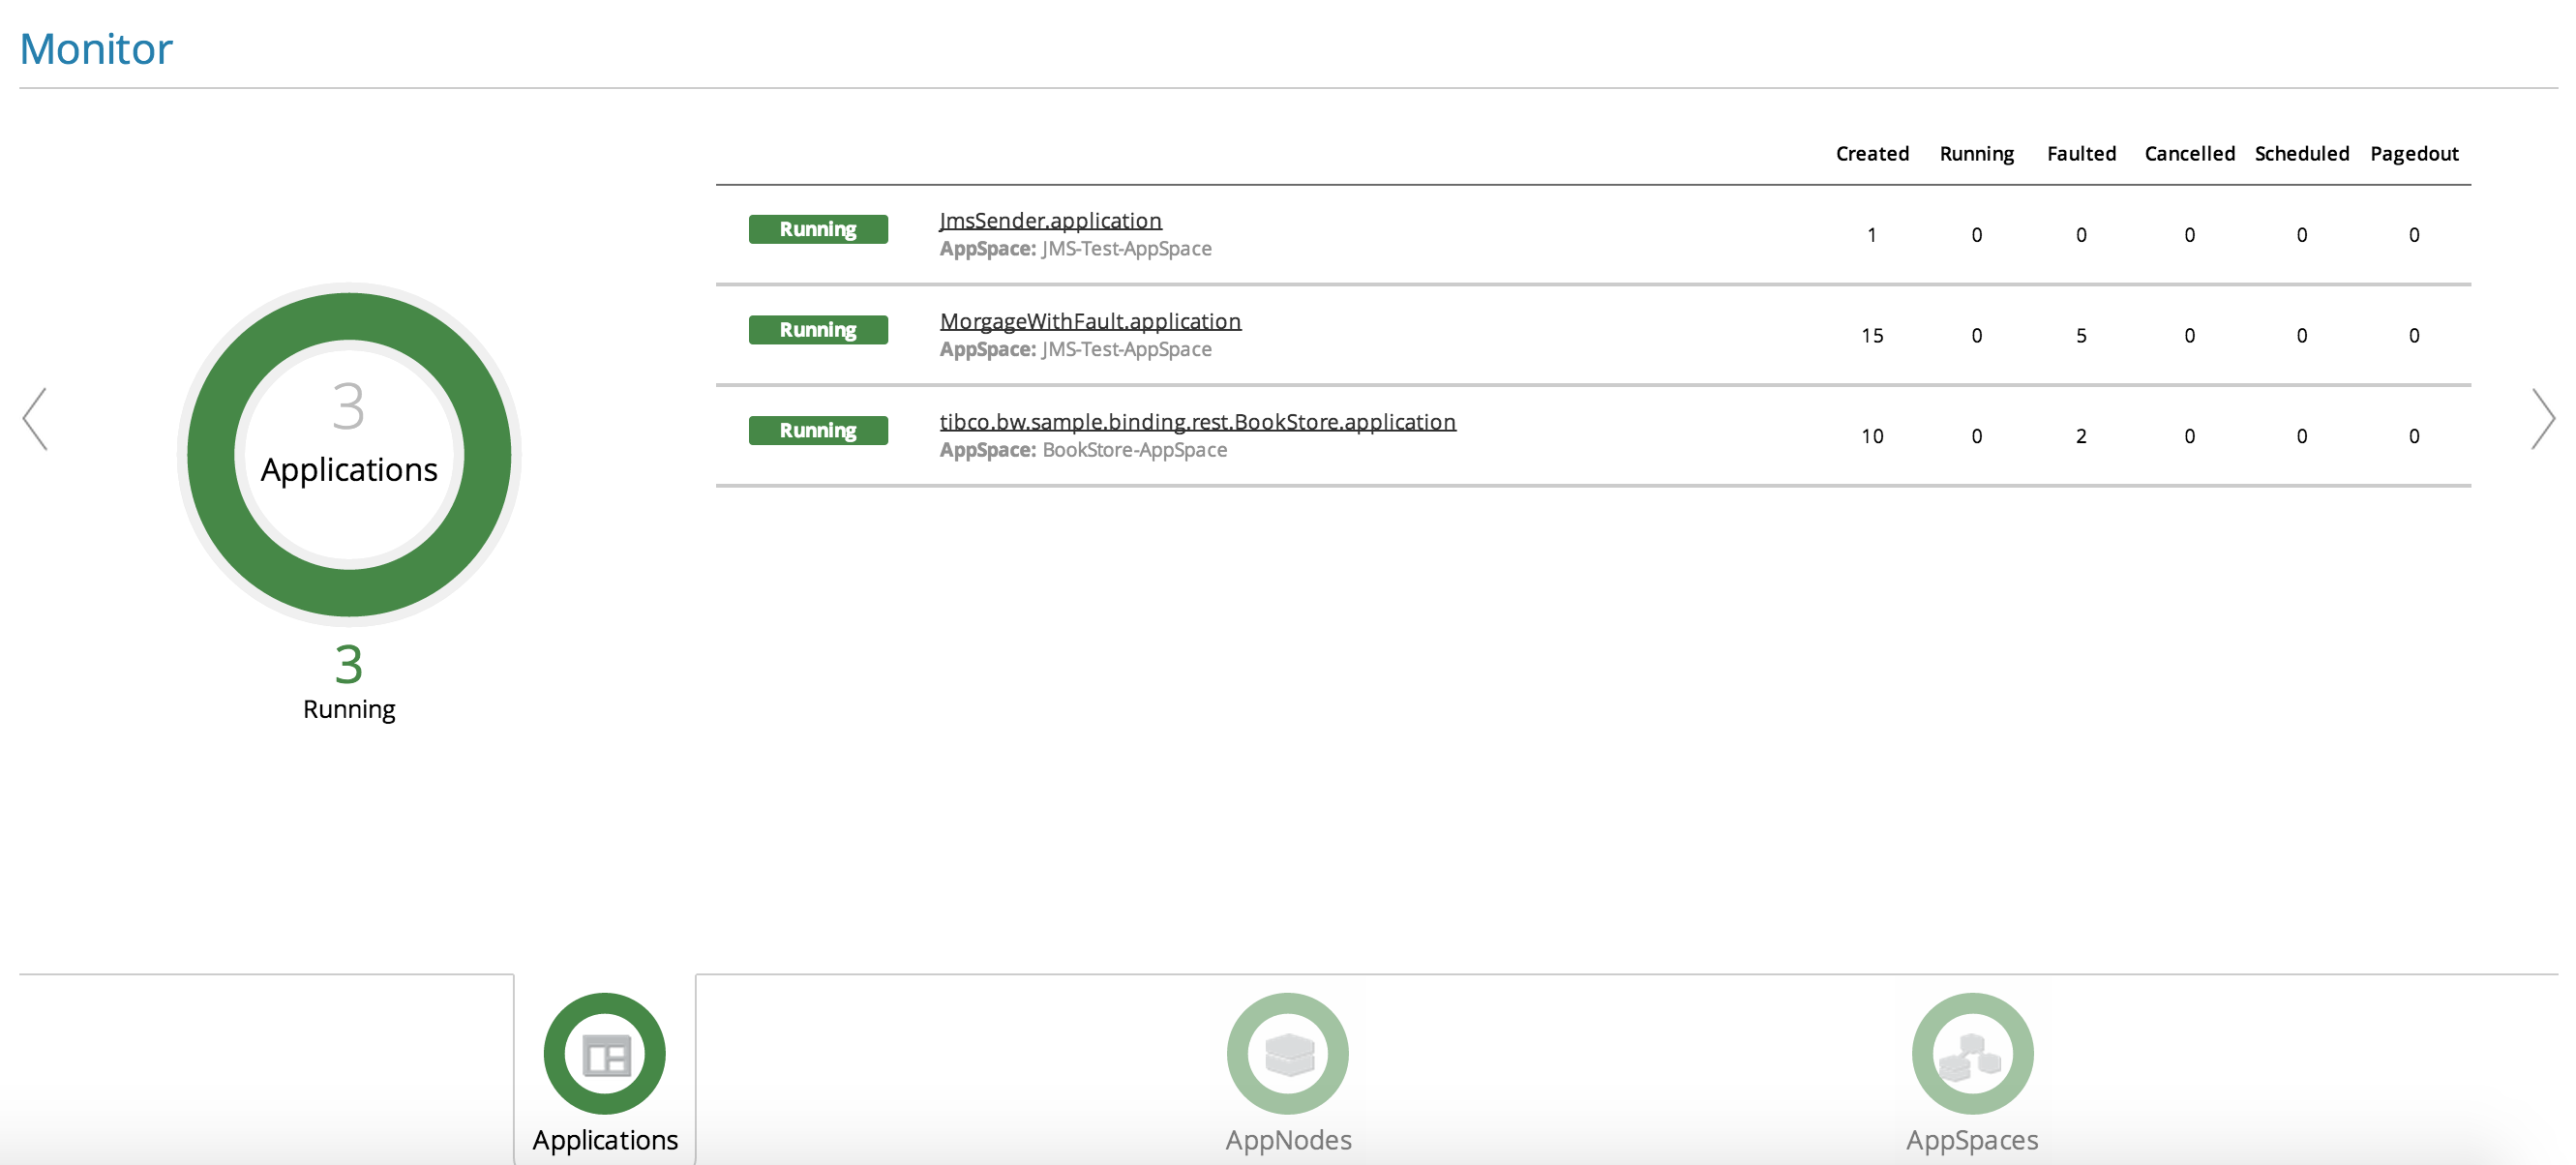
View Application Data
To view application job counts on each AppNode, select the
Application tab, and click the
![]() icon to switch to the Monitoring View.
icon to switch to the Monitoring View.
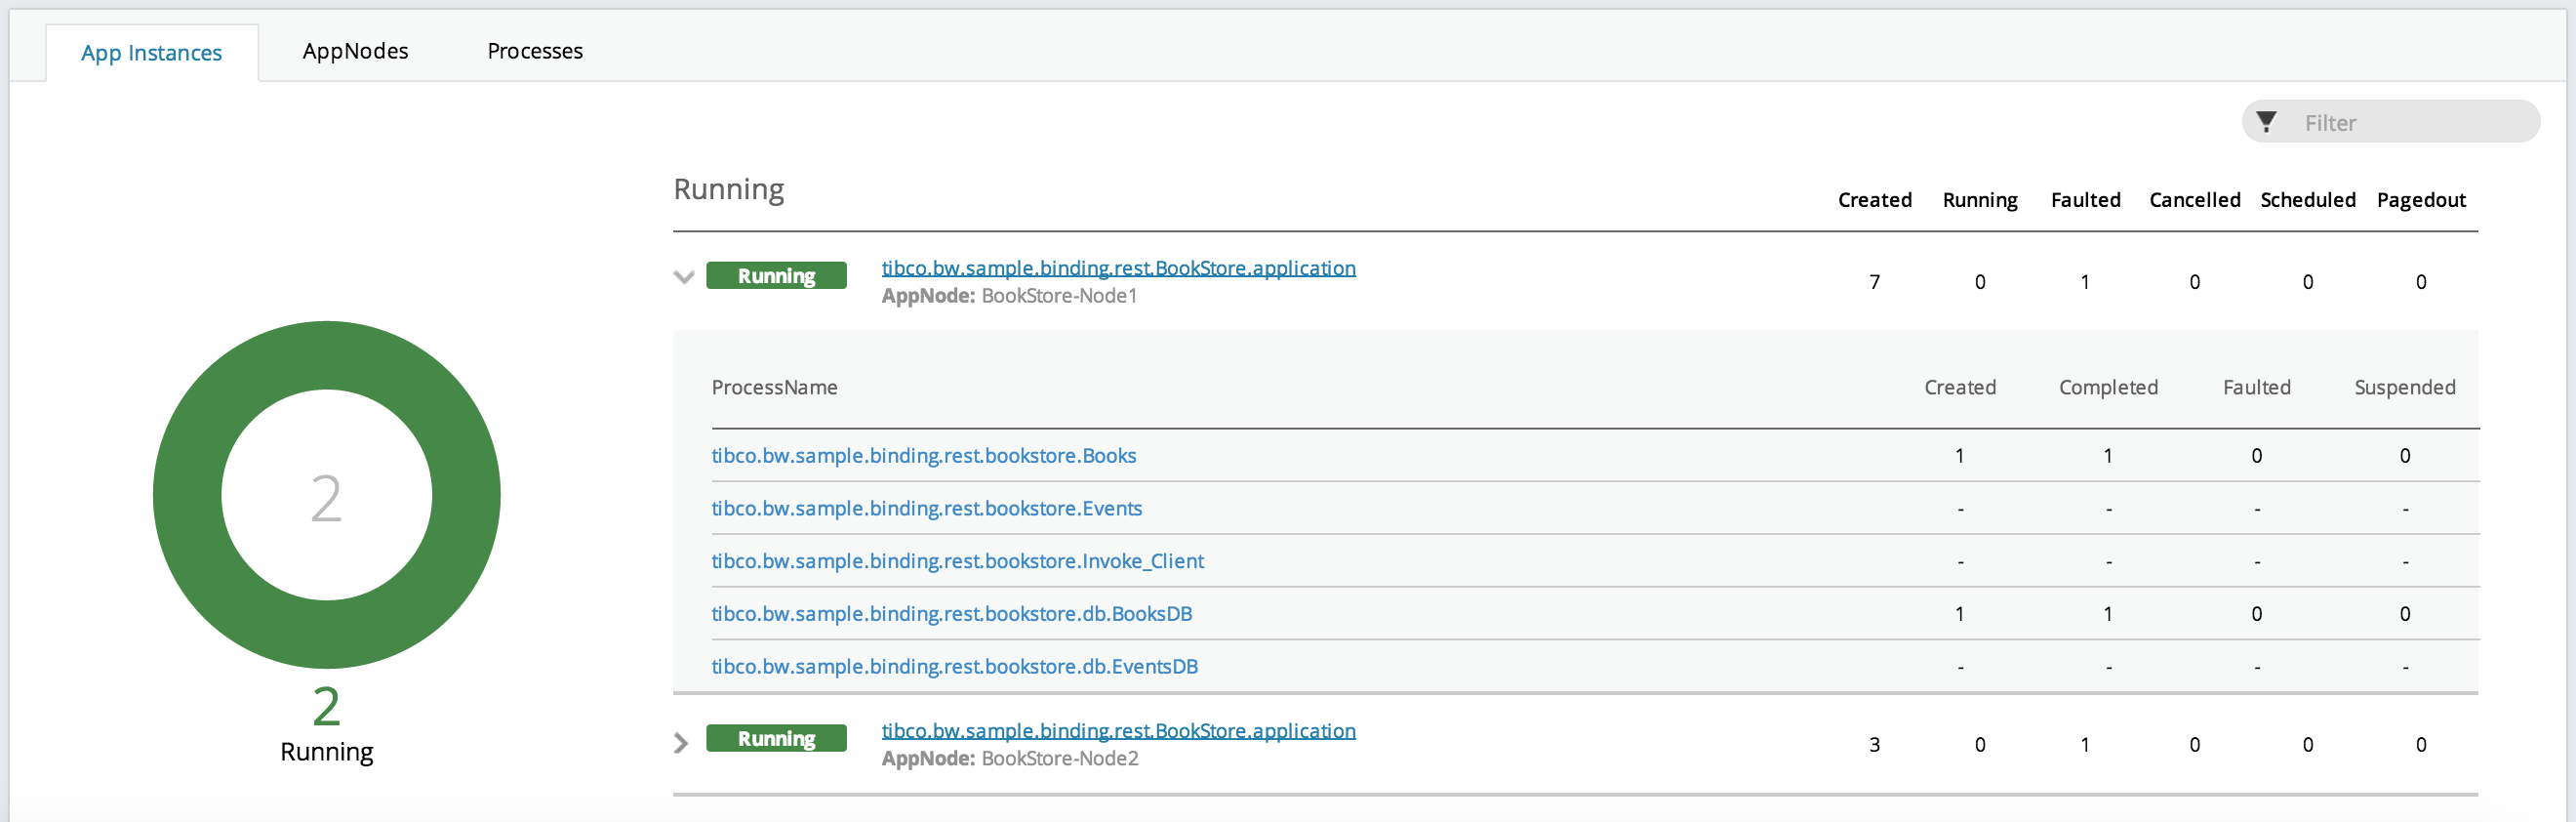
View Process Data
Ensure you are on the
Application tab, and click the
![]() icon to switch to the Monitoring View. Next, select an application and expand it to view job process counts.
icon to switch to the Monitoring View. Next, select an application and expand it to view job process counts.
To view process instrumentation data, click on an individual process. The Admin UI switches to the Processes tab, and the process diagram, along with process instrumentation data, displays.
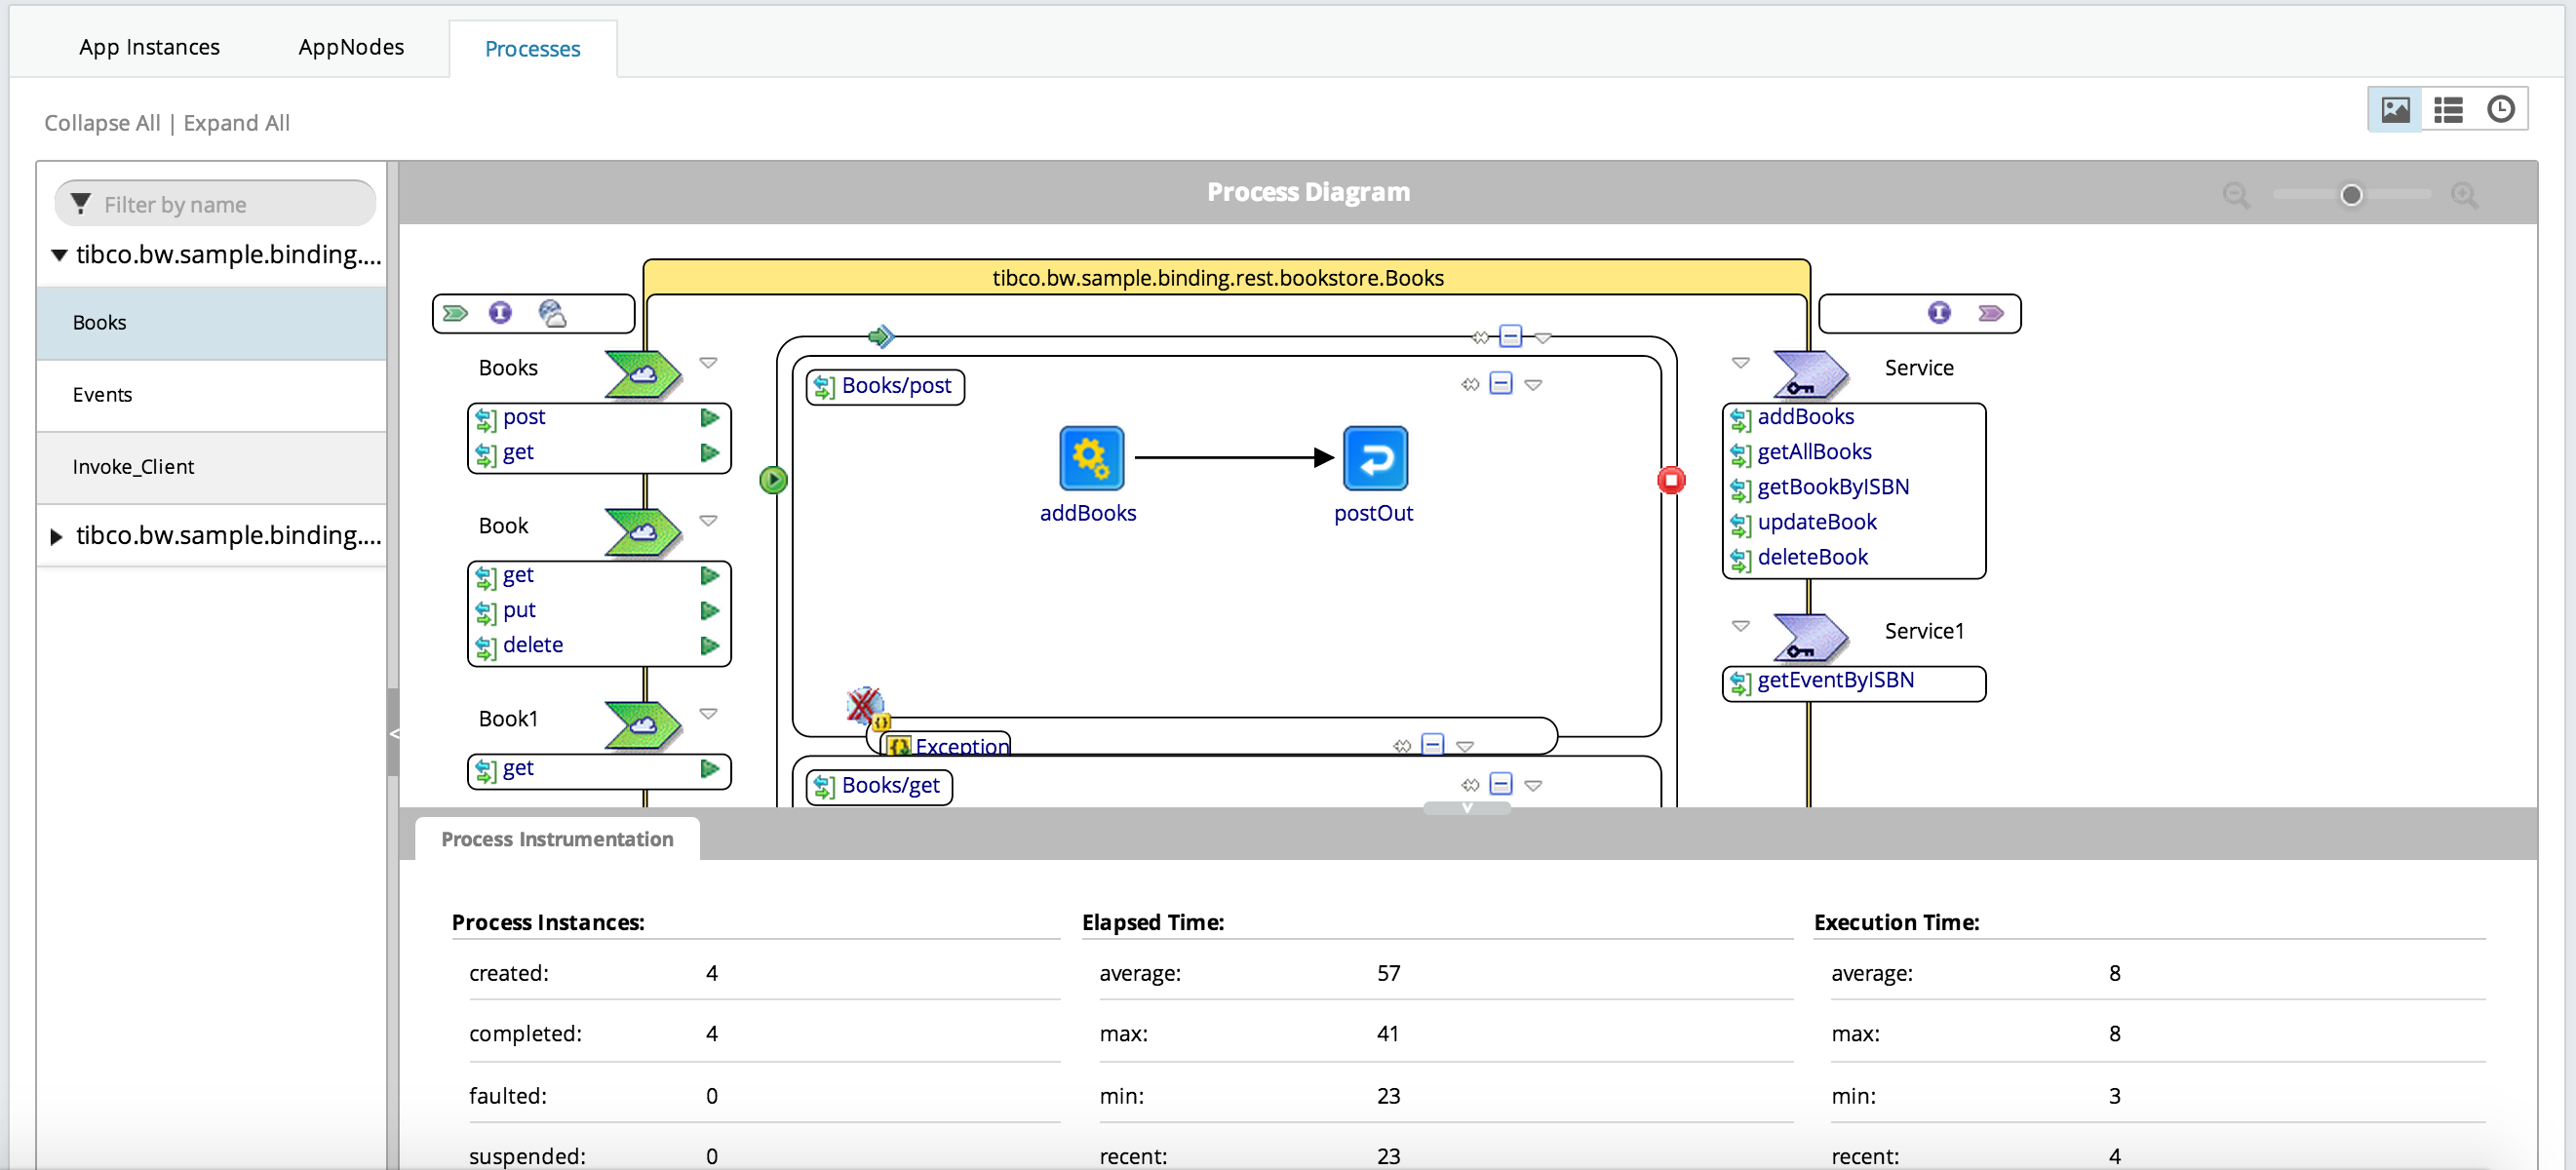
View Activity Data
Select the
Application tab, click the
![]() icon to switch to Monitoring View, and select the
Processes tab to view the process diagram. From this point you can view activity instrumentation data by clicking on an activity in the process diagram, or clicking the
icon to switch to Monitoring View, and select the
Processes tab to view the process diagram. From this point you can view activity instrumentation data by clicking on an activity in the process diagram, or clicking the
![]() icon to the top left corner of the
Processes tab.
icon to the top left corner of the
Processes tab.

View Process and Activity Instance Data Logged to an External Database
Ensure you are on the
Application tab, and click the
![]() icon to switch to Monitoring View. Expand an application to view the individual processes, and select one. Next, click the
Processes tab, and click the
icon to switch to Monitoring View. Expand an application to view the individual processes, and select one. Next, click the
Processes tab, and click the
 icon, located at the top left corner of the
Processes tab, to view process instance details. Click on a process instance ID to view its activity instances.
icon, located at the top left corner of the
Processes tab, to view process instance details. Click on a process instance ID to view its activity instances.
