Monitoring Threads and Taking a Thread Dump Using JVisualVM

You can use JVisualVM to monitor threads and take thread dumps for an AppNode containerand bwagent.

Procedure

  1. Enable JMX on the AppNode or bwagent by adding the following JMX properties in the AppNode or the agent TRA files for remote monitoring.
    • java.property.com.sun.management.jmxremote=true
    • java.property.com.sun.management.jmxremote.port=8008
    • java.property.com.sun.management.jmxremote.authenticate=false
    • java.property.com.sun.management.jmxremote.ssl=false
  2. Start jvisualvm.exe from the JDK_HOME/version/bin directory.
  3. Connect to the application container remotely or by using the JMX_PORTConnect to the AppNode or bwagent remotely or by using the PID. To connect remotely, select Remote in the Applications tab and right click Add Remote Host. Enter the remote Host name field.

  4. Add JMX connection to the remote host as displayed in the images below.

  5. Right click the remote JMX connection for the ContainerAppNode or bwgent and select Open.
  6. The AppNode or agent 
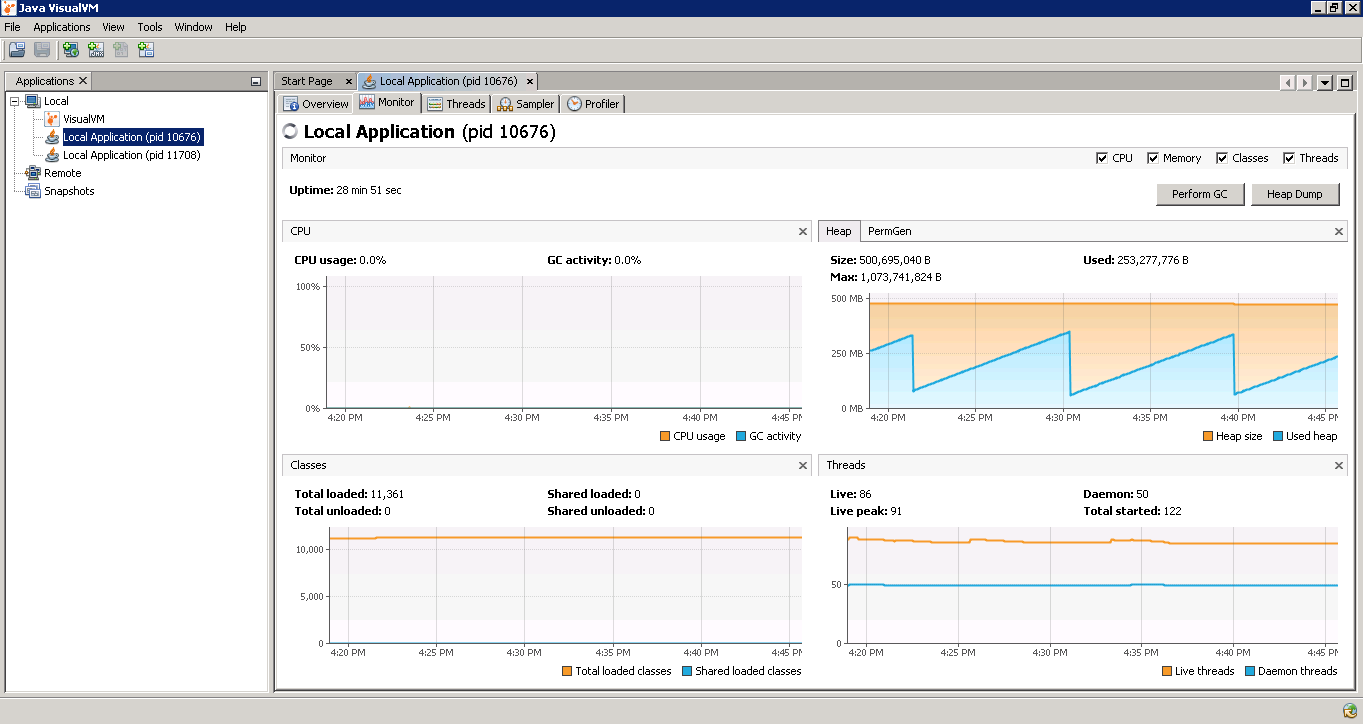
CPU, memory, classes and threads can be monitored in the Monitor tab. The memory chart also provides the maximum memory settings of the JVM. You can perform a manual GC and obtain the heap dump too.

    The following figure demonstrates the typical heap usage pattern of the AppNode , which is a sawtooth pattern. This sawtooth pattern indicates the normal behaviour of the JVM. For more information, see the Stack Overflow website. Here the memory usage steadily increases and then drops due to garbage collection.

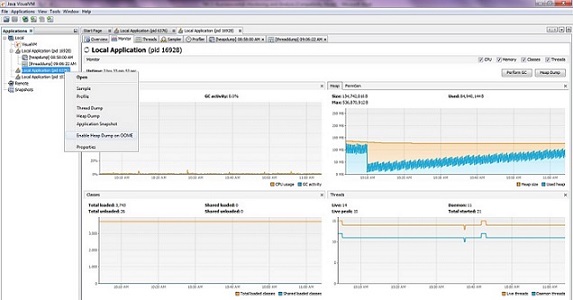
    The figure below displays the heap dump summary once the dump is obtained.

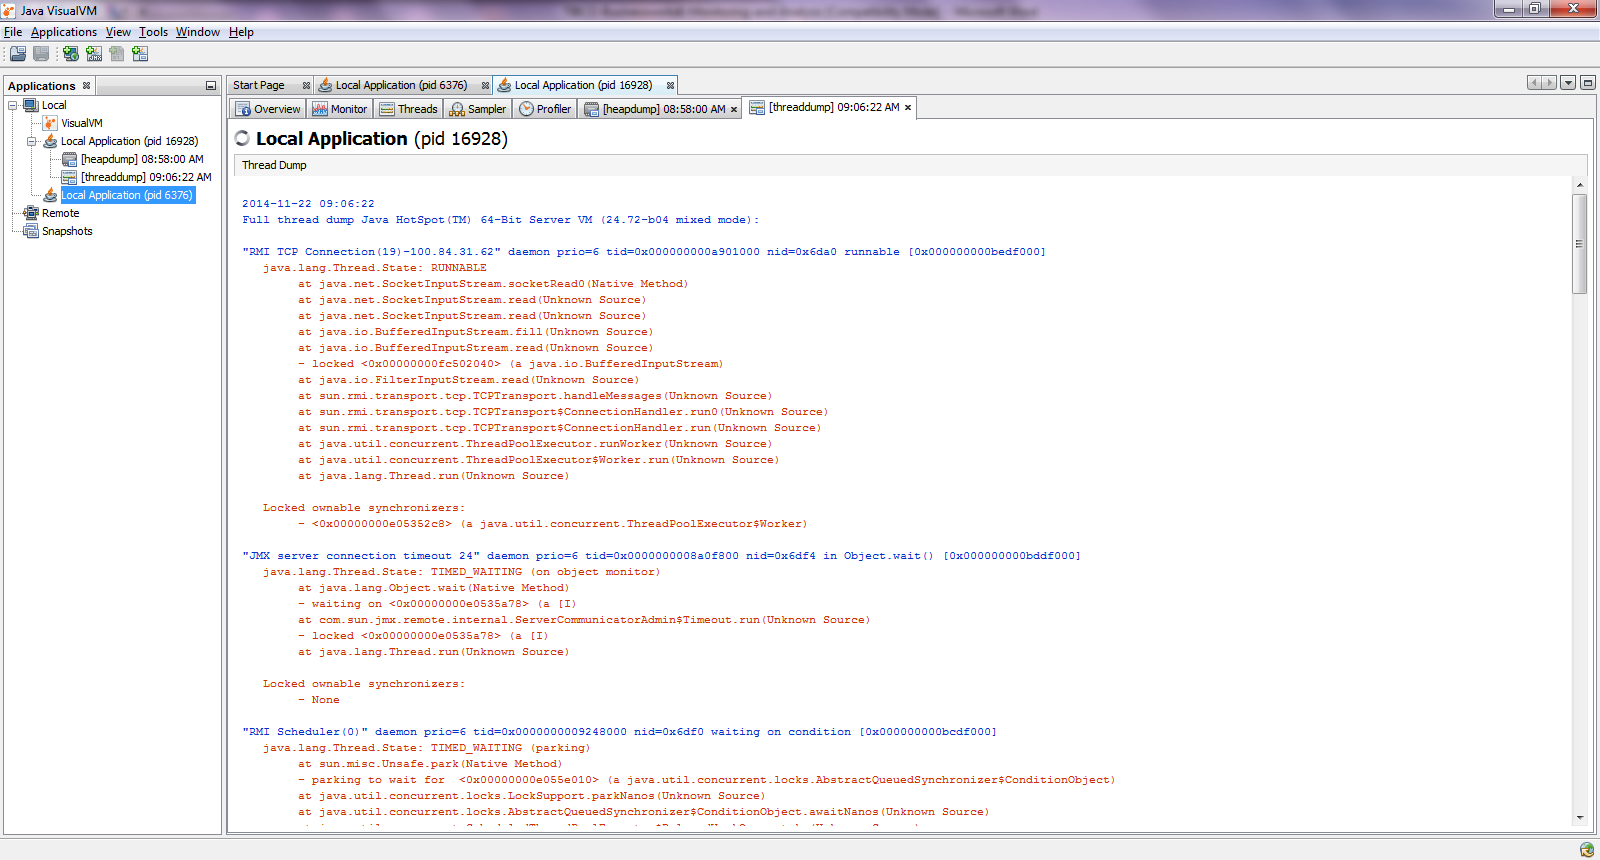
  7. You can monitor the thread states and obtain the thread dump from the Threads tab.

  1. You can use JVisualmVM to configure an option to generate heap dump if the AppNode or bwgent runs out of memory. Right click a JMX connection, and select Enable Heap Dump on OOME as shown in the image below.

  2. JVisualVM provides CPU and memory profiling capabilities. By default, the profiling tool is not in a running state until you are ready to profile the application. You can choose from the following profiling options:
    1. CPU Profiling - Select CPU Profiling to profile and analyze the performance of the application in terms of throughput, scalability or response time.
    2. Memory Profiling - Select Memory Profiling to analyze the memory usage of the application. The results display the objects allocated by the application and the class allocating those objects.

      When you start a profiling session, JVisualVM attaches to the local or remote AppNode or agent and starts collecting the profiling data.

      When the profiling results are available, they are displayed in the Profiler tab.

      JVisualVM has the following plugins for java implementation:

      1. A sampling profiler - Statistical and light weight
      2. An instrumental profiler - Heavier
      Note: CPU and memory usage in the Monitor tab are for BW Application running inside a container. In actual scenario we may need to set the container memory greater than the JVM heap size.