OpenTracing is an open, vendor neutral standard for distributed systems that can be used to keep track of the current state of the job.
TIBCO ActiveMatrix BusinessWorks™ supports Jaeger libraries to display span for each activity and process instance during job execution. Span corresponds to a process instance as well as an activity instance that has information such as ActivityName, JobID, process instance ID etc. For every process instance, root span is created and all the activity instances are child spans of it.
Note: OpenTracing does not support checkpointing. Activities recovered after restarting are not seen on Jaeger UI.
Trace represents multiple related process instance spans.
Note: In case of HTTP palette, JMS palette, REST binding, and SOAP binding, client and server process instances are shown in one trace, whereas for all other palettes, every process instance is a trace.
For more information about Jaeger, see
Jaeger documentation.
Configure the following BWEngine property in the
BW_JAVA_OPTS environment variable while running the application to enable and disable OpenTracing at an AppNode level:
- bw.engine.opentracing.enable=true.
Note: By default, the property is false.
Additionally you can configure a few more properties specific to Jaeger.
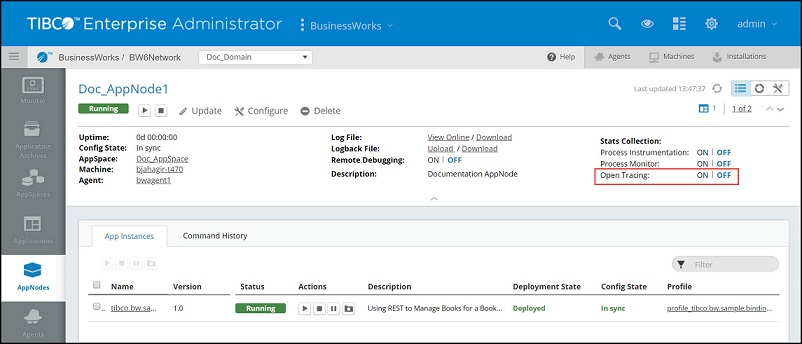
Admin UI
Enable or disable OpenTracing at an AppNode Page 2 level.
Open Tracing via UDP connection
For obtaining Open Tracing via UDP connection, configure the following Jaeger properties:
| Properties
|
Description
|
| JAEGER_SAMPLER_MANAGER_HOST_PORT
|
The host name and port when using the remote controlled sampler.
|
| JAEGER_AGENT_HOST
|
The hostname for communicating with agent via UDP.
|
| JAEGER_AGENT_PORT
|
The port for communicating with agent via UDP
|
Open Tracing via HTTP connection
For obtaining Open Tracing via HTTP connection, configure the following Jaeger properties:
| Properties
|
Description
|
| JAEGER_SAMPLER_MANAGER_HOST_PORT
|
The host name and port when using the remote controlled sampler.
|
| JAEGER_ENDPOINT
|
The traces endpoint, in case the client should connect directly to the Collector. For example,
http://<jaeger-collector>:<port>/api/traces
|
For more information about the properties, see
Configuration via Environment section at github.com.
Supported tags for querying on Jaeger UI
Currently, the following tags are supported for querying on Jaeger UI.
| Tag
|
Description
|
| SpanInitiator
|
Name of the process starter activity
|
| DeploymentUnitName
|
Name of the application
|
| DeploymentUnitVersion
|
Version of the application
|
| AppnodeName
|
Name of an AppNode on which an application is running.
|
| Hostname
|
Name of the machine on which a
TIBCO ActiveMatrix BusinessWorks™ application is running.
|
| IP
|
IP address
|
| ActivityName
|
Name of an activity in a process
|
| ActivityID
|
Id of an activity
|
| ProcessInstanceId
|
Process instance ID
|
| JobId
|
Job ID of the process.
|
| ProcessName
|
Name of the process displayed for starter activities.
|
Dynamically Enabling and Disabling Open Tracing
You can enable OpenTracing without restarting an AppNode or an application with the help of following CLI commands.
| Command
|
Description
|
| enableopentracing
|
Enable open tracing for an AppNode
|
| disableopentracing
|
Disable open tracing for an AppNode
|
Copyright © 2020. TIBCO Software Inc. All Rights Reserved.

