Configuring the Debugger
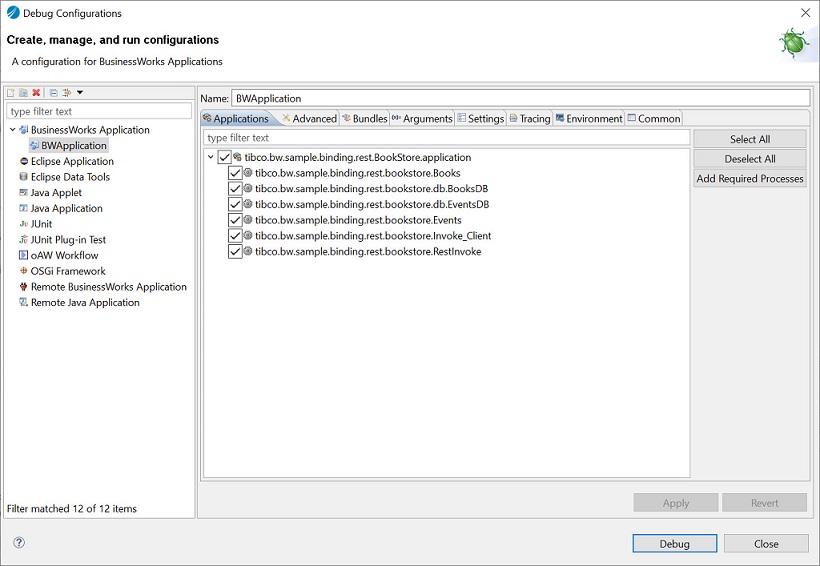
You can use Debug configuration to create, manage, and run configurations in TIBCO Business Studio™ for BusinessWorks™.
Using the
Debug Configurations dialog box, you can select the following:
- Applications to debug.
- Advanced configurations such as logging configuration and engine debug port.
- Arguments: program arguments such as the target operating system, target architecture, target web services, working directory, and so on, and VM arguments such as TIBCO_HOME, port number, or any engine properties that need to be set when running the application.
- Settings that define the Java Runtime Environment such as Java executable and runtime JRE, configuration area, and so on.
- Tracing criteria for the available OSGi bundles. By default, tracing is disabled. When enabled, you can choose among the available OSGi bundles, and then select the desired tracing criteria for each of them.
- Environment variables such as PATH, LD_LIBRARY_PATH, and so on.
- Common settings where you can save the configuration either as a local or a shared file and display them in the favorites menu (Debug and/or Run), define encoding for the files, and so on.
After selecting the options, click Apply to apply the changes or Debug to launch the debugger with the selected debug configuration.
For components or main processes that have dependent subprocesses, the debug configuration operation allows you to add required processes.
Copyright © 2020. TIBCO Software Inc. All Rights Reserved.

 Launch BusinessWorks Debugger