Enabling Process Monitoring
Process monitoring can be configured from thebwagent_db.json or
bwagent_ftl.json files. Set the property
statsprovider to
true to enable process monitoring.
You can use same or different databases for process monitoring.
Process Monitoring
The transport layers communicate between the bwagent and the AppNode, and the supported transport layers are REST, UDP, and FTL. The default transport layer is REST. For the REST transport layer, the default monitor data format is JSON. This is the default setting in the BWAgent and the AppNode.
The statstransport property is also added to the AppNode config file when the AppNode is created.
For more information about REST, UDP, and FTL configurations, see Configuring using REST, Configuring using UDP and Configuring using FTL respectively.
To access the process monitoring landing page, go to the
Application Level 2 page, navigate to the
Process
tab, click the
Graph View icon
 and click the
Process Instance icon
and click the
Process Instance icon
 . You can also use the shortcut key Shift + P to navigate to the process monitoring landing page directly.
All the instances, processes and subprocesses of the selected application are displayed on the landing page.
You can begin monitoring your process instances once you enable the Process Instance icon after deploying the application.
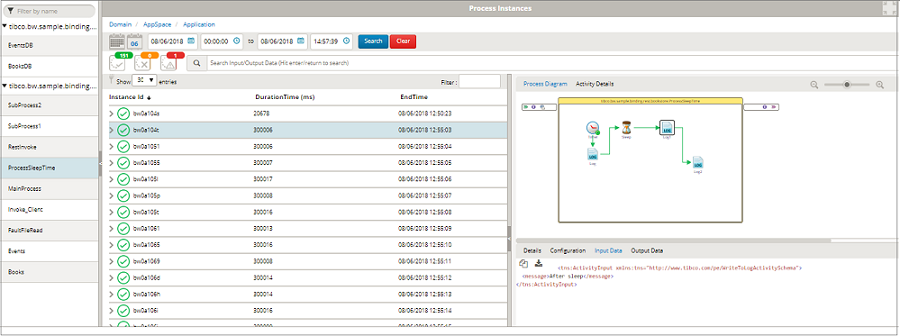
By default, all the instances in the selected process are displayed. Subprocesses, if any, can be viewed by expanding the process.
In the above example, click the process Books. Job data related to the Books process is displayed in a tabular form, and the process diagram of the process is also displayed.
Additional Features
In the Admin UI the following details are displayed in the default view.
- Instance Id - displays all the (instance ids of the) process instances.
- DurationTime (ms) - displays the total time taken to execute the process instance (in milliseconds)
- EndTime- time when the process instance ended.
The columns displayed in the default view can also be customized to display additional information about the process instances. Use the
Select Columns filter
 to add the columns,
AppNodes,
StartTime, and
DurationTime (ms).
to add the columns,
AppNodes,
StartTime, and
DurationTime (ms).
The other filters provided in Admin UI are:
| Filter | Description |
| Date filters | Job data can be filtered for a particular date or a time range. Alternatively, the Calendar icon filters and displays job data for Last Month and Today. |
| Job Status filters |
Job data can be filtered based on their completion status. Select the
The icon,
|
| Search Input/Output Data | This filter searches thorough the input and output data and displays the required information. |
| Filter | This filter searches through the instances that are displayed for any specific value provided in this filter text box. |


Navigating through the UI
To navigate through the Domain quickly, the Admin UI also provides breadcrumb navigation. The Domain link in the breadcrumb navigation, Domain/ AppSpaces/ Application navigates to the page where all the applications within the domain are displayed. The AppSpace link navigates to the tab, and the Application link navigates to the page where all the application instances for all the processes are displayed.
The process diagram and activity details for each process instance is displayed in the extreme right panel. Click the process instance in the second panel, and the process diagram for that instance is displayed. The executed transitions and flow is displayed. The Details tab, Configuration, Input Data and Output Data tabs contain the configuration, input and output details of the process instance.
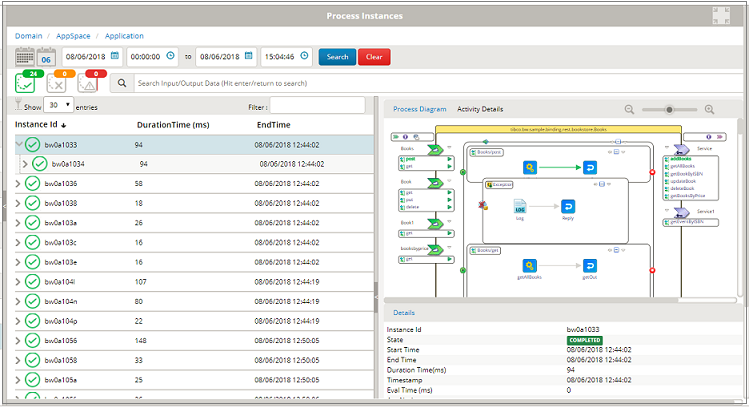
Selecting any instance from the table highlights the reference or service, if any, and also highlights in green, the activity transitions that were successfully executed.
Fix any ActivityID related warnings displayed in Studio , and then create the EAR file to ensure the plotting and Input and Output data is displayed correctly.
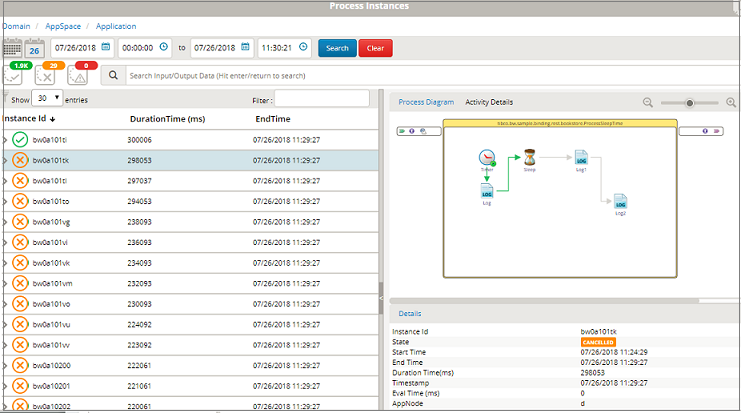
The process monitoring for canceled jobs displays the successful transactions in green up until the point where the process was successfully executed.
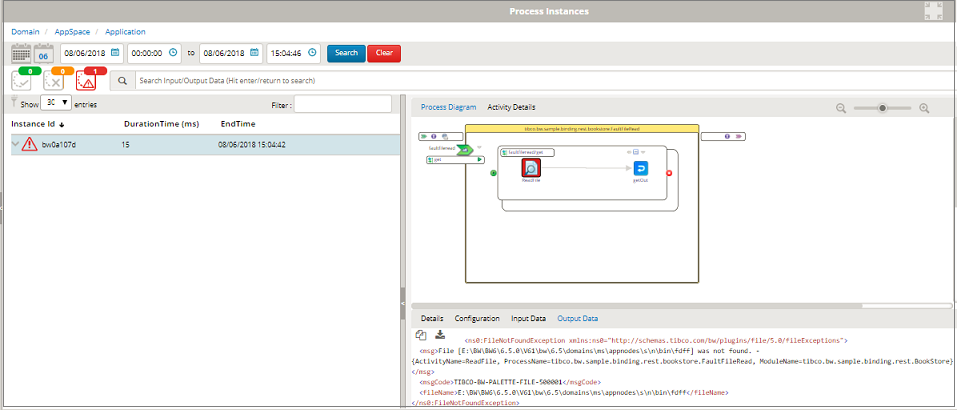
Processes that faulted due to errors are highlighted in red. The Ouput Data tab displays the error due to which the process faulted.