OpenTelemetry
OpenTelemetry is an open, vendor neutral standard for distributed systems that can be used to keep track of the current state of the job. OpenTelemetry is a set of APIs, SDKs, tooling, and integrations designed to create and manage telemetry data such as traces.
TIBCO ActiveMatrix BusinessWorks™ supports all OpenTelemetry compliant telemetry backends to display span for each activity and process instance during job execution. Span corresponds to a process instance as well as an activity instance that has information such as ActivityName, JobID, process instance ID etc. For every process instance, root span is created and all the activity instances are child spans of it.
Trace represents multiple related process instance spans.
For more information about OpenTelemetry, see OpenTelemetry documentation.
Configure the following BWEngine property in the BW_JAVA_OPTS environment variable while running the application to enable and disable OpenTelemetry at an AppNode level:
- bw.engine.opentelemetry.enable=true.
Note: By default, the property is false. In case of TIBCO BusinessWorks Container Edition, it is mandatory to set this property.
Additionally you can configure the following properties specific to OpenTelemetry:
| Property | Value | Description |
|---|---|---|
| bw.engine.opentelemetry.span.processor |
Possible values are SPAN or BATCH. The default value is BATCH. |
Configure Span Processor type |
| bw.engine.opentelemetry.span.processor.delay | value in milliseconds | Sets the delay interval between two consecutive exports |
| bw.engine.opentelemetry.span.processor.timeout | value in milliseconds | Sets the maximum time an export is allowed to run before being canceled |
| bw.engine.opentelemetry.span.processor.batch.size | Integer value in kb. | Sets the maximum batch size for every export. This must be smaller or equal to maxQueuedSpans |
| bw.engine.opentelemetry.span.processor.queue.size | Queue size in kb | Sets the maximum number of Spans that are kept in the queue before start dropping. More memory than this value may be allocated to optimize queue access |
| bw.engine.opentelemetry.span.sampler |
ON, OFF, 0.0 to 1.0. The default value is ON. |
Configure Span Sampler type |
| bw.engine.opentelemetry.span.exporter | OTLP-GRPC |
This property helps you to set custom exporter injected as a service. The value of this property should be the component name of the service. For Jaeger exporter,
the value for this property should be set to |
| bw.engine.opentelemetry.span.exporter.endpoint | http://<host>:<port> |
Sets the OTLP or Jaeger endpoint to connect to. Note: In case of TIBCO BusinessWorks Container Edition, it is mandatory to set this property.
|
| bw.engine.opentelemetry.span.exporter.timeout | value in milliseconds | Sets the maximum time to wait for the collector to process an exported batch of spans |
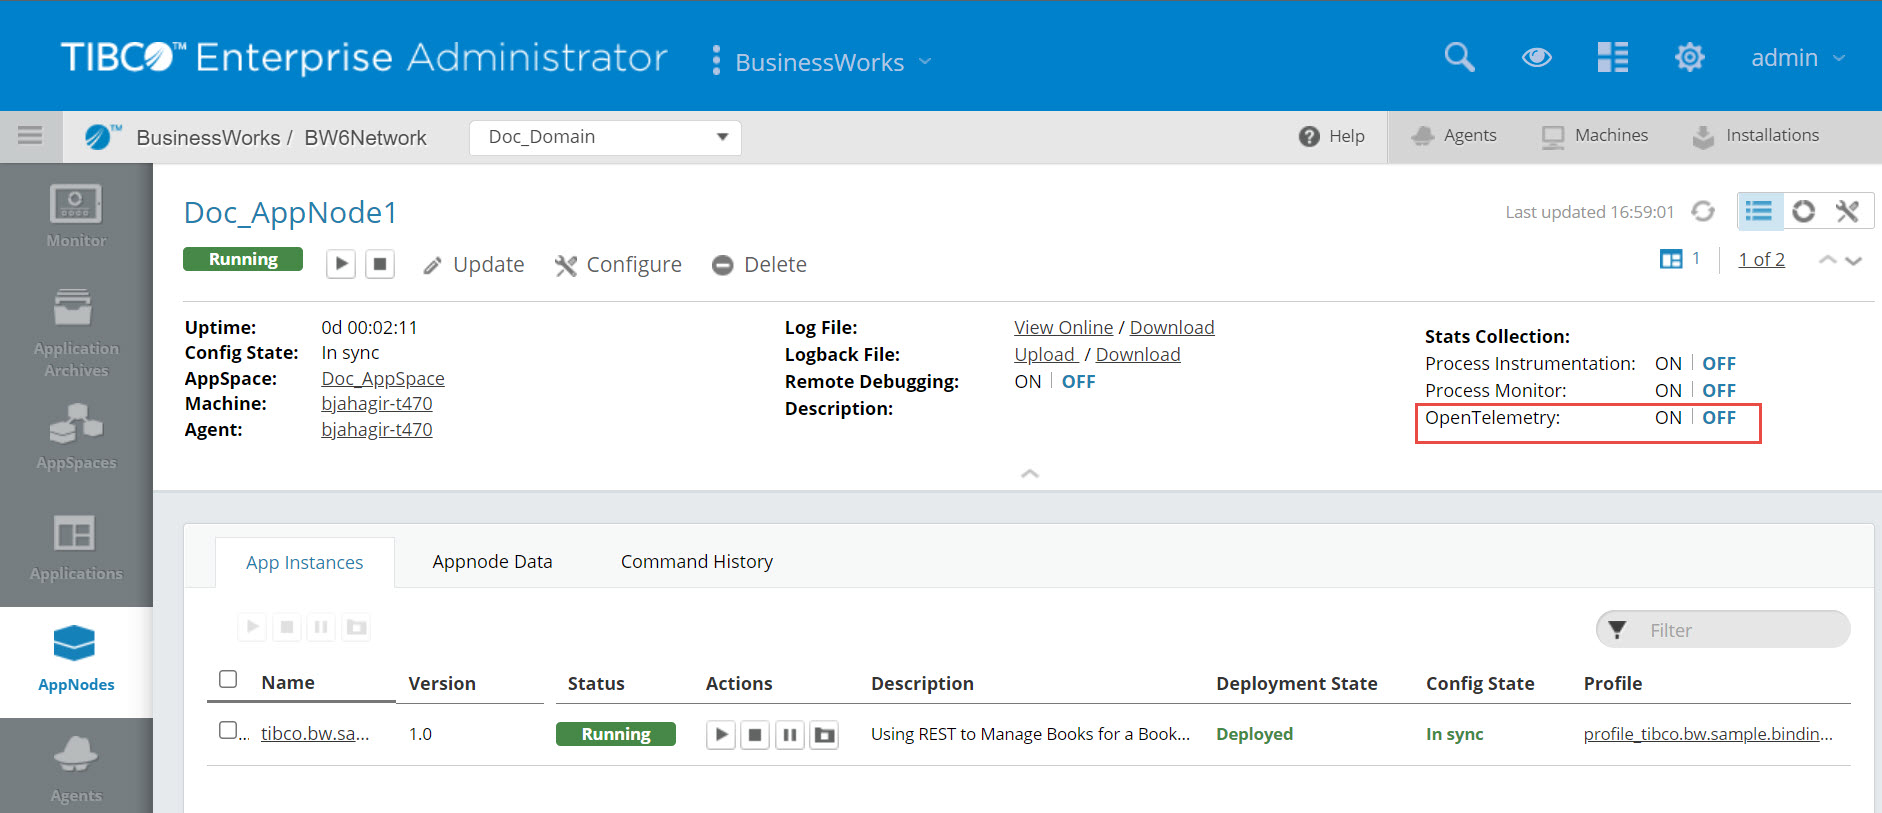
Admin UI
Enable or disable OpenTelemetry at an AppNode Page 2 level.
Supported tags for querying on OpenTelemetry
Currently, the following tags are supported for querying on OpenTelemetry:
| Tag | Description |
|---|---|
| SpanInitiator | Name of the process starter activity |
| DeploymentUnitName | Name of the application |
| DeploymentUnitVersion | Version of the application |
| AppnodeName | Name of an AppNode on which an application is running. |
| Hostname | Name of the machine on which a TIBCO ActiveMatrix BusinessWorks™ application is running. This tag is applicable for Jaeger exporter UI. |
| IP | IP address. This tag is applicable for Jaeger exporter UI. |
| ActivityName | Name of an activity in a process |
| ActivityID | Id of an activity |
| ProcessInstanceId | Process instance ID |
| JobId | Job ID of the process. |
| ProcessName | Name of the process displayed for starter activities. |
Dynamically Enabling and Disabling OpenTelemetry
You can enable and disable OpenTelemetry without restarting an AppNode or an application with the help of following Admin CLI commands:
| Command | Description |
|---|---|
| enableopentelemetry | Enable OpenTelemetry for an AppNode |
| disableopentelemetry | Disable OpenTelemetry for an AppNode |
OpenTelemetry via OpenTelemetry-collector
- Set up the OpenTelemetry-collector service. You can further integrate OpenTelemetry with a tracing service provider which is compliant with OpenTelemetry.
-
To configure OpenTelemetry with OpenTelemetry-collector, set the
bw.engine.opentelemetry.enable=trueproperty in an AppNode'sconfig.inifile.
OpenTelemetry via Jaeger span exporter
- Set up a Jaeger service.
-
To configure opentelemetry with Jaeger span exporter by using following properties:
bw.engine.opentelemetry.enable=true
bw.engine.opentelemetry.span.exporter=com.tibco.bw.opentelemetry.exporter.jaeger
bw.engine.opentelemetry.span.exporter.endpoint=http://localhost:14250
By default, the OpenTelemetry traces by using Jaeger Span Exporter and OpenTelemetry Collector are available on Jaeger UI at http://localhost:16686/