GANTT Chart Details
The different color schemes used in the GANTT chart to visually represent the status of the execution plan and plan item sections are as follows:
GANTT Chart Background Colors
The background color describes the status of the plan. The following figure displays the background color codes representing the execution plan in different states:
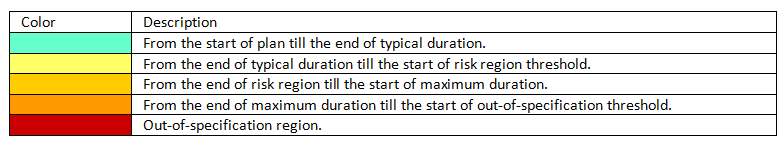
Each color in the GANTT chart has its own significance. The following table describes the GANTT chart background colors:
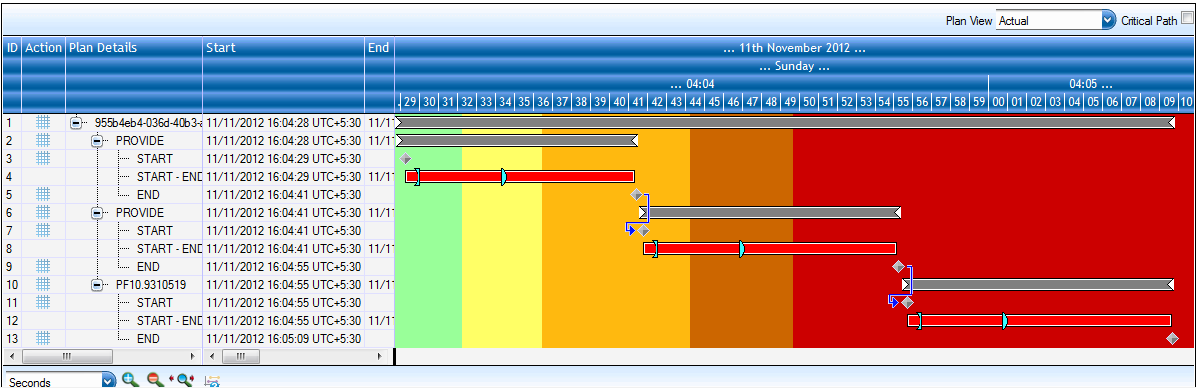
GANTT Chart Section Color
The Section level color code describes the status of the section. The following figure displays the section color codes representing the plan item section in different states:
 .
.
The following figure displays all the available section colors:

The following table describes the GANTT chart section level colors:

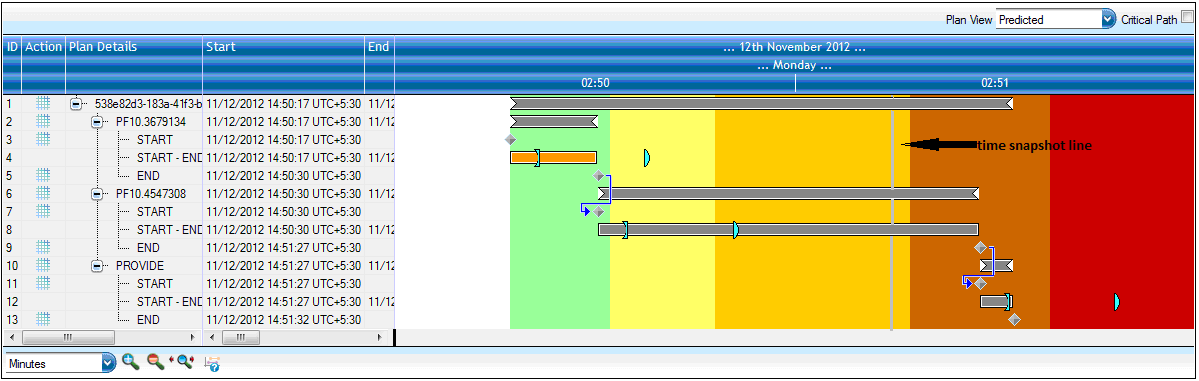
GANTT Chart Time Snapshot Line
The Time snapshot line represents the time when Gantt chart is loaded on the UI.