Configuring TIBCO Service Performance Manager Service Probe
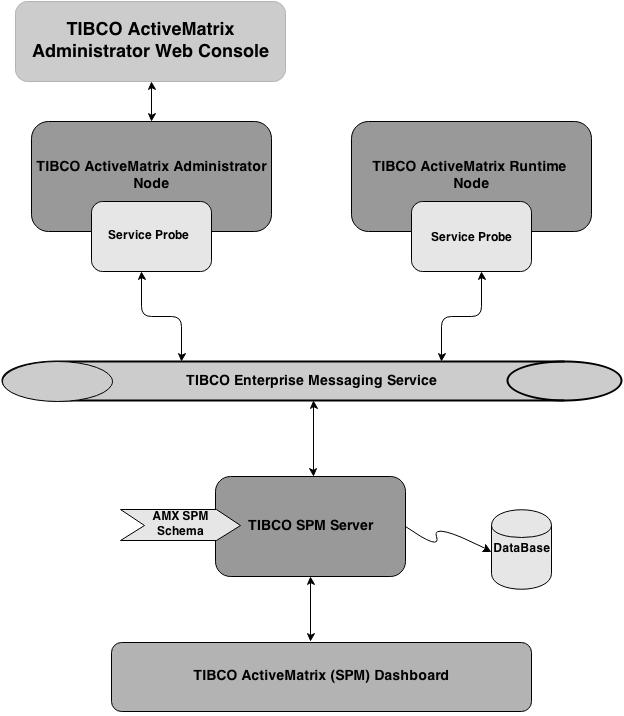
The service probe publishes service statistics and life-cycle events to TIBCO Service Performance Manager.
The TIBCO ActiveMatrix Administrator node publishes information about life-cycle events of TIBCO ActiveMatrix assets such as nodes, applications, services, and certain shared resource instance types to TIBCO Service Performance Manager. Additionally, it also publishes the availability details of the TIBCO ActiveMatrix assets on an hourly basis.
All TIBCO ActiveMatrix runtime nodes, where the service probe has been enabled, publish statistical information to the TIBCO Service Performance Manager over a TIBCO Enterprise Messaging Server queue. The following information is published:
- Service and Reference statistics
- Node JVM statistics
- Resource instance statistics for HTTP Connectors, JDBC, JMS Connection Factory and ThreadPool Shared Resources
- Metrics-related data to SPM for applications that use Virtualization Bindings, JMS Bindings, and SOAP Bindings
After the service probe is enabled on any TIBCO ActiveMatrix node, statistics are emitted periodically to the TIBCO Service Performance Manager server asynchronously via EMS. Additionally, the TIBCO ActiveMatrix Administrator node also emits asset status.
The TIBCO Service Performance Manager server receives the statistics from all the TIBCO ActiveMatrix nodes that have the service probe enabled. The TIBCO Service Performance Manager server then applies some statistical computations on the received data in real-time, stores it, and renders it via the TIBCO ActiveMatrix Dashboard, a presentation UI that is separate from TIBCO ActiveMatrix Administrator.

