Monitoring Applications and Cloud Infrastructure from the Application Monitor
You can monitor the ActiveMatrix Service Grid - Container Edition applications deployed on the Docker and Kubernetes platforms from the Application Monitor. The Application Monitor is a web UI that functions in TIBCO® Enterprise Administrator (TEA).
ActiveMatrix Service Grid - Container Edition provides an agent for TIBCO Enterprise Administrator, which allows you to monitor and administer ActiveMatrix Service Grid - Container Edition applications. For more information about TIBCO Enterprise Administrator, see the TIBCO Enterprise Administrator documentation.
By using the Application Monitor, you can view data related to the Kubernetes and ActiveMatrix Service Grid - Container Edition nodes on a single dashboard. The dashboard displays data about Kubernetes resources such as running pods, deployments, namespaces, and states. You can also monitor runtime entities such as ActiveMatrix Service Grid - Container Edition environments, applications, nodes, and bindings in the enterprise.
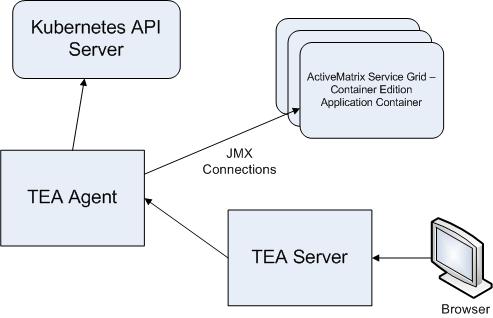
Application Monitor architecture is as shown in the following diagram. From the browser, you can access the Application Monitor UI. Application Monitor runs in TIBCO Enterprise Administrator (TEA). The Application Monitor TEA agent communicates with the TIBCO Enterprise Administrator server for UI interactions and communicates with the ActiveMatrix Service Grid - Container Edition application containers by using JMX. Application Monitor creates two JMX connections to each ActiveMatrix Service Grid - Container Edition node or application, one to call JMX endpoints and get data and the second to register a JMX notification listener to detect any state change in the ActiveMatrix Service Grid - Container Edition node. Kubernetes related data is fetched from the Kubernetes API server.