Viewing Dashboard
Application Monitor dashboard provides a graphical representation (in the form of a chart, bar, and line graph) for application status, environment, node status, application hit counts, memory usage by Node, and overall memory usage in the enterprise. Environment, Node Status, and Application Status charts provide the drill-down capability to view more details.
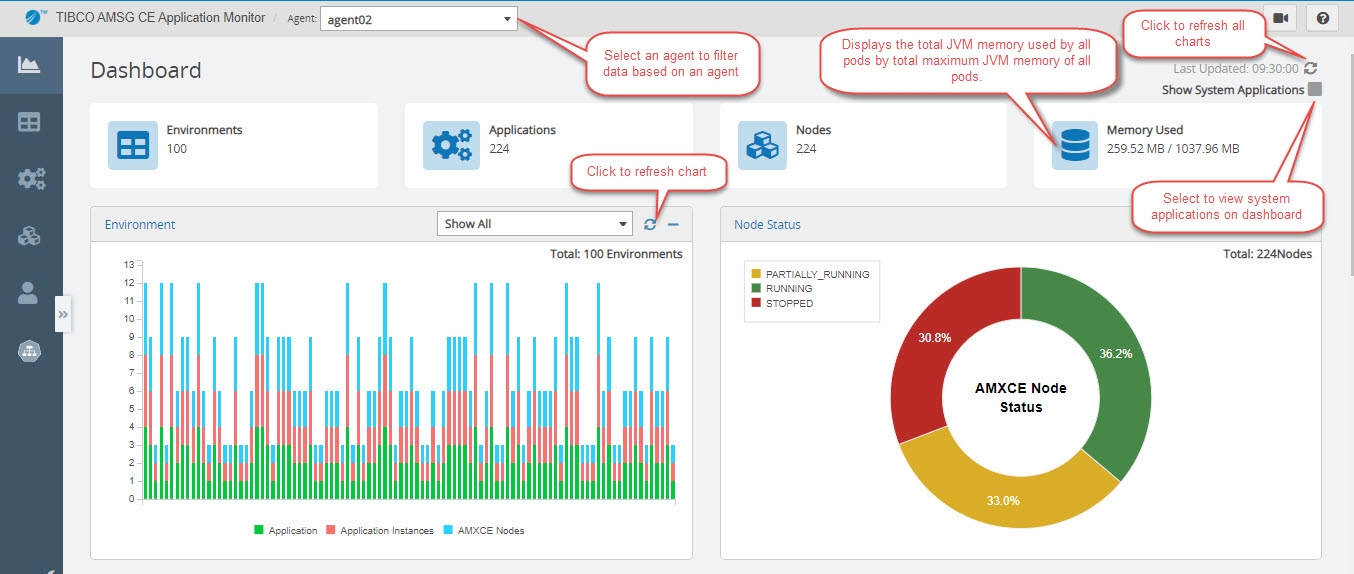
If multiple agents are configured, you can filter data on the dashboard by selecting an agent from the Agent list at the top.
To view system applications on the dashboard, select the Show System Applications check box in the upper-right corner of the Dashboard page.
The following sections are displayed on the dashboard page:
Information Cards
The following information cards are displayed on the dashboard:
- Environments: Total number of environments. Click to navigate to the Environments page.
- Applications: Total number of applications. Click to navigate to the Applications page.
- Nodes: Total number of nodes. Click to navigate to the Nodes page.
- Memory Used: Displays the total JVM memory used by all pods by the total maximum JVM memory of all pods.
Environments
Environments chart display stacked bar chart for application, application instances, and AMXCE nodes in the environment. Click an environment bar to view the environment details. You can filter environments data by selecting one or more environments from the drop-down list at the top. Total number of environments is displayed in the upper-right corner. You can view only Applications, Application Instances, or AMXCE Nodes, or any combination of these by clicking check boxes at the bottom of the Environments chart. By default, Applications, Application Instances, and AMXCE Nodes are displayed in the stacked bar chart.
Node Status
This section displays a doughnut chart for the nodes based on their status. Each colored section denotes different statuses, for example: Running, Stopped, or Partially running. Click any section of the doughnut chart to open the list of nodes with that status. The total number of nodes is displayed in the upper-right corner.
Application Status
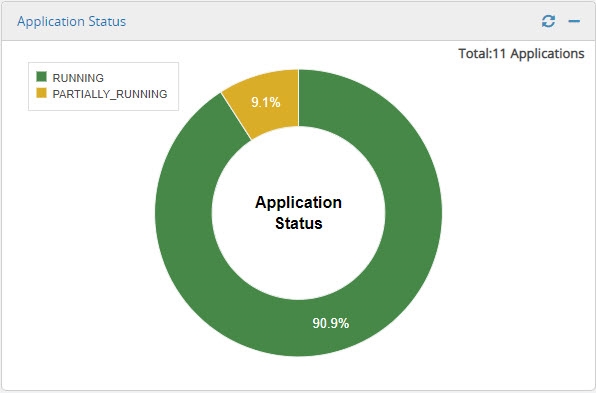
This section displays a doughnut chart for the applications based on their status. Each colored section denotes different status, for example: Running, Stopped, or Partially running. Click any section of the doughnut chart to open the list of applications with that status. The total number of applications is displayed in the upper-right corner.
Prometheus Configuration
To view the Overall Memory by Type, Application Hit Count, and Memory Usage by Node charts, you must configure Prometheus with Application Monitor agent. Use the following environment variable in the amsgce-runtime-<version>/samples/kubernetes/Application_Monitor/tea-agent.yaml file. Use the port on which Prometheus is running.
name: amxce_prometheus_ui
value: http://$(HOST_IP):31055/
Overall Memory by Type
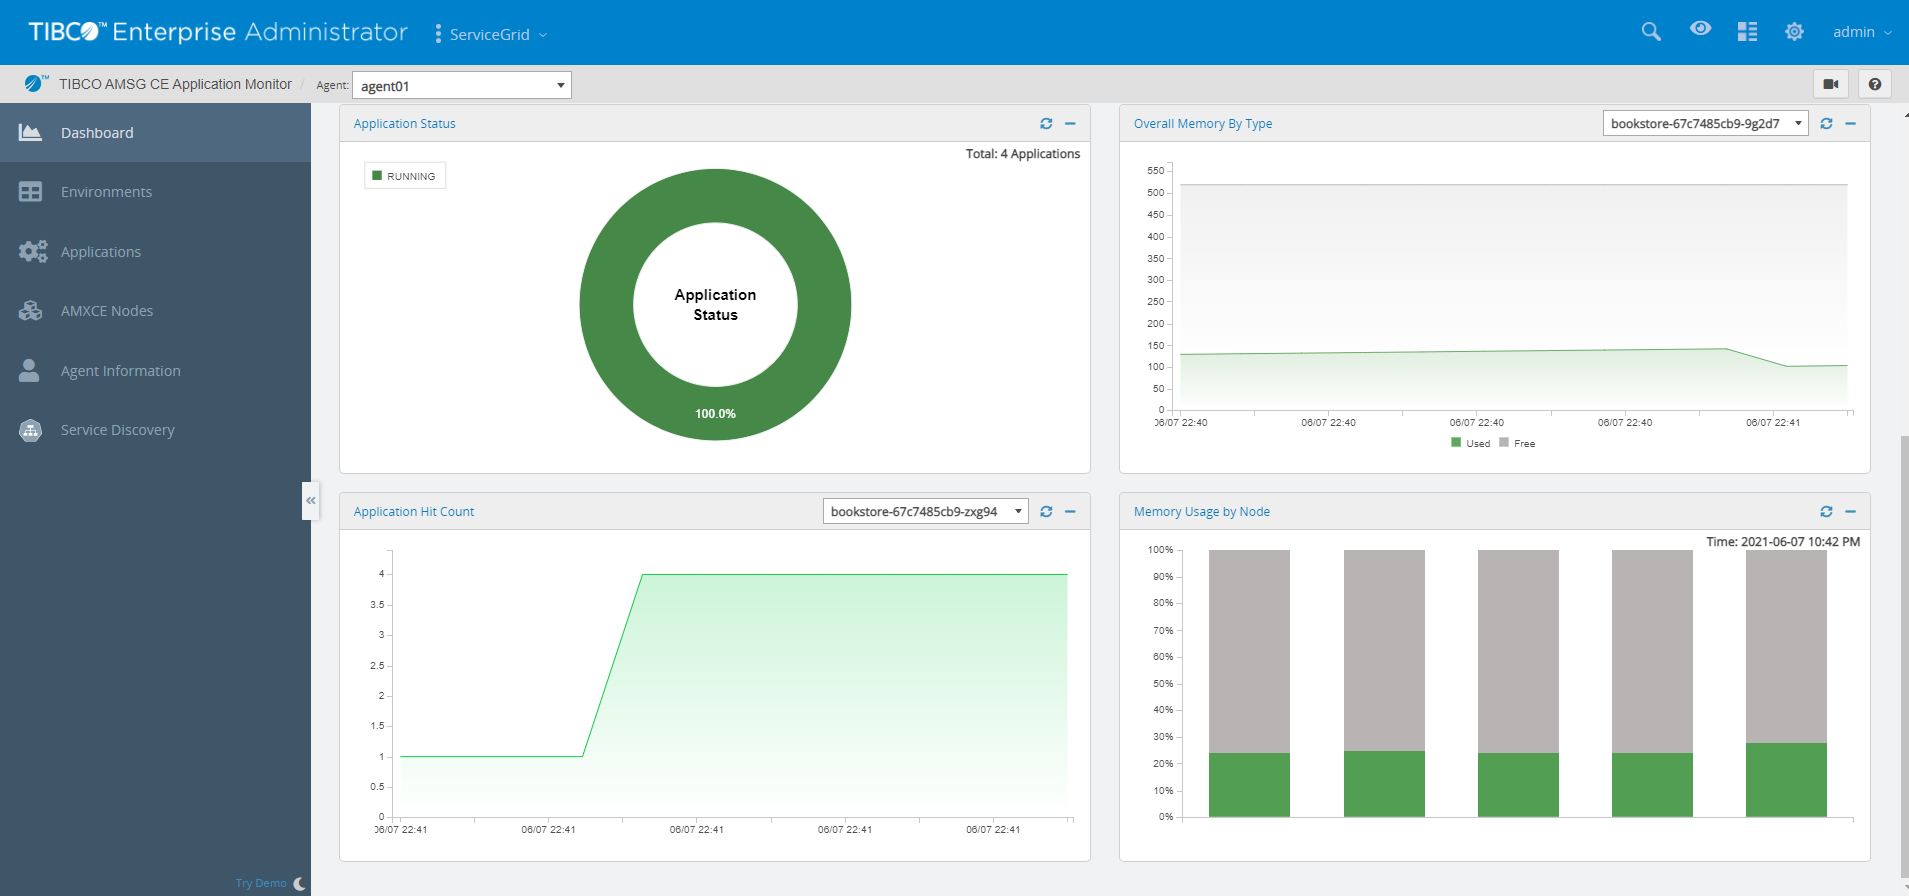
This chart displays the maximum used and free JVM memory by a pod. You can select a pod from the drop-down list. Data displayed is the average over the past minute for the selected pod. Gray color represents free memory.
Application Hit Count
Application hit count measures the number of times the application was accessed. This chart displays the total number of application hit counts for the selected application over the last minute. To view hits for an application, select the application pod from the drop-down list.
Memory Usage by Node
Each bar in the Memory Usage by Node chart represents the pod and the stack represents used and free memory (in percentage). The values displayed are the average of the data over the past 10 minutes. Grey color displays the free memory. The color for used memory is green when minimal is used and ranges to red when memory usage is maximum.


