Viewing and Downloading Node Health Check Information
The following Health Check information about a runtime node is provided:
-
General information such as the Node Startup Time and the Time to build the HealthCheck and so on.
- JVM Information such as JVM arguments for AMXCE Node, thread information and so on.
- JVM memory usage with details of allocated, free, maximum, and used values.
- Machine-specific information. It provides details such as machine name, Username, CPU count, operating system, memory, and swap space.
- TIBCO
CONFIG_HOMEinformation.
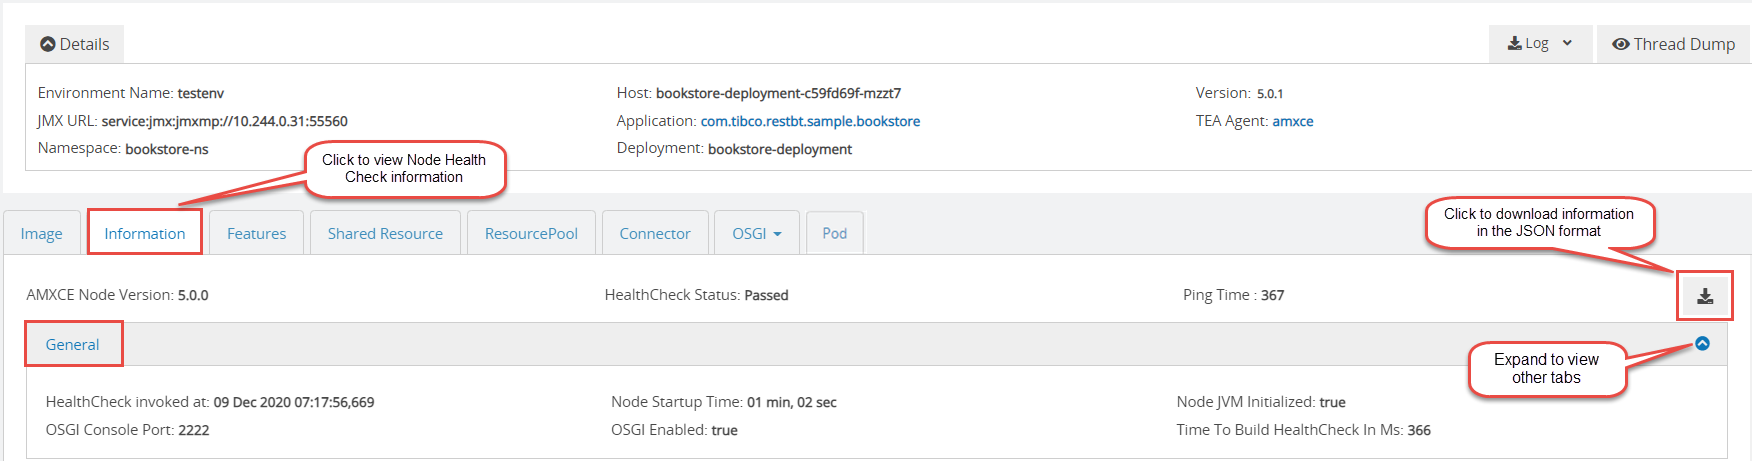
To view Health Check information, on the node details page, go to the Information tab. Expand the sections on the page to view information.
com.tibco.noMessagingBus=truecom.tibco.amx.rad=true
if the following property is set in the application node_jvm_parameter file then Health Check fails:
com.tibco.serviceprobe.monitoring.enabled=false
To Download Health Check Information (JSON)
To download the node health check information data as a JSON file, click Download JSON  in the upper-right corner as highlighted in the above image. This JSON file contains all the data displayed on the UI. The default name of the file that gets downloaded is
 Node_Name_TIME_STAMP.json.