Viewing AMXCE Nodes Information
AMXCE node is the runtime environment for applications. Nodes exist in an environment and are managed by containers. In ActiveMatrix Service Grid - Container Edition, a node runs as an integration node. A node acts as a sandbox for applications. One application instance runs on one AMXCE node.
You can navigate to the nodes page in one of the following ways:
From the Applications Page
-
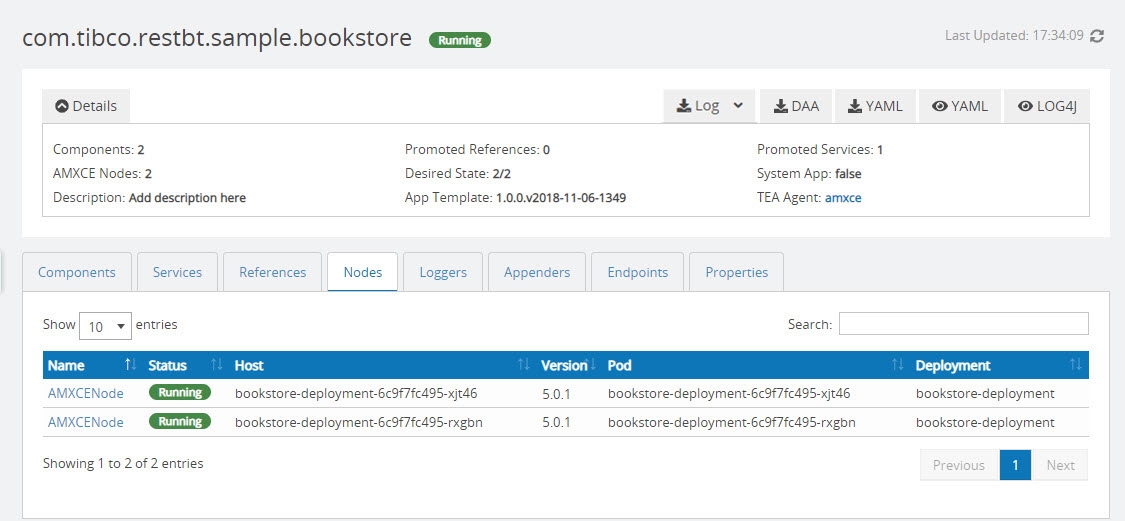
On the Applications page, select an application to view details.
-
To view the AMXCE node information on which the application is running, click the Nodes tab. The AMXCE nodes on which the application is running are displayed. Click a node name to view its details.

From the AMXCE Nodes tab
To view the AMXCE nodes information, in the Application Monitor, click the AMXCE Nodes tab.
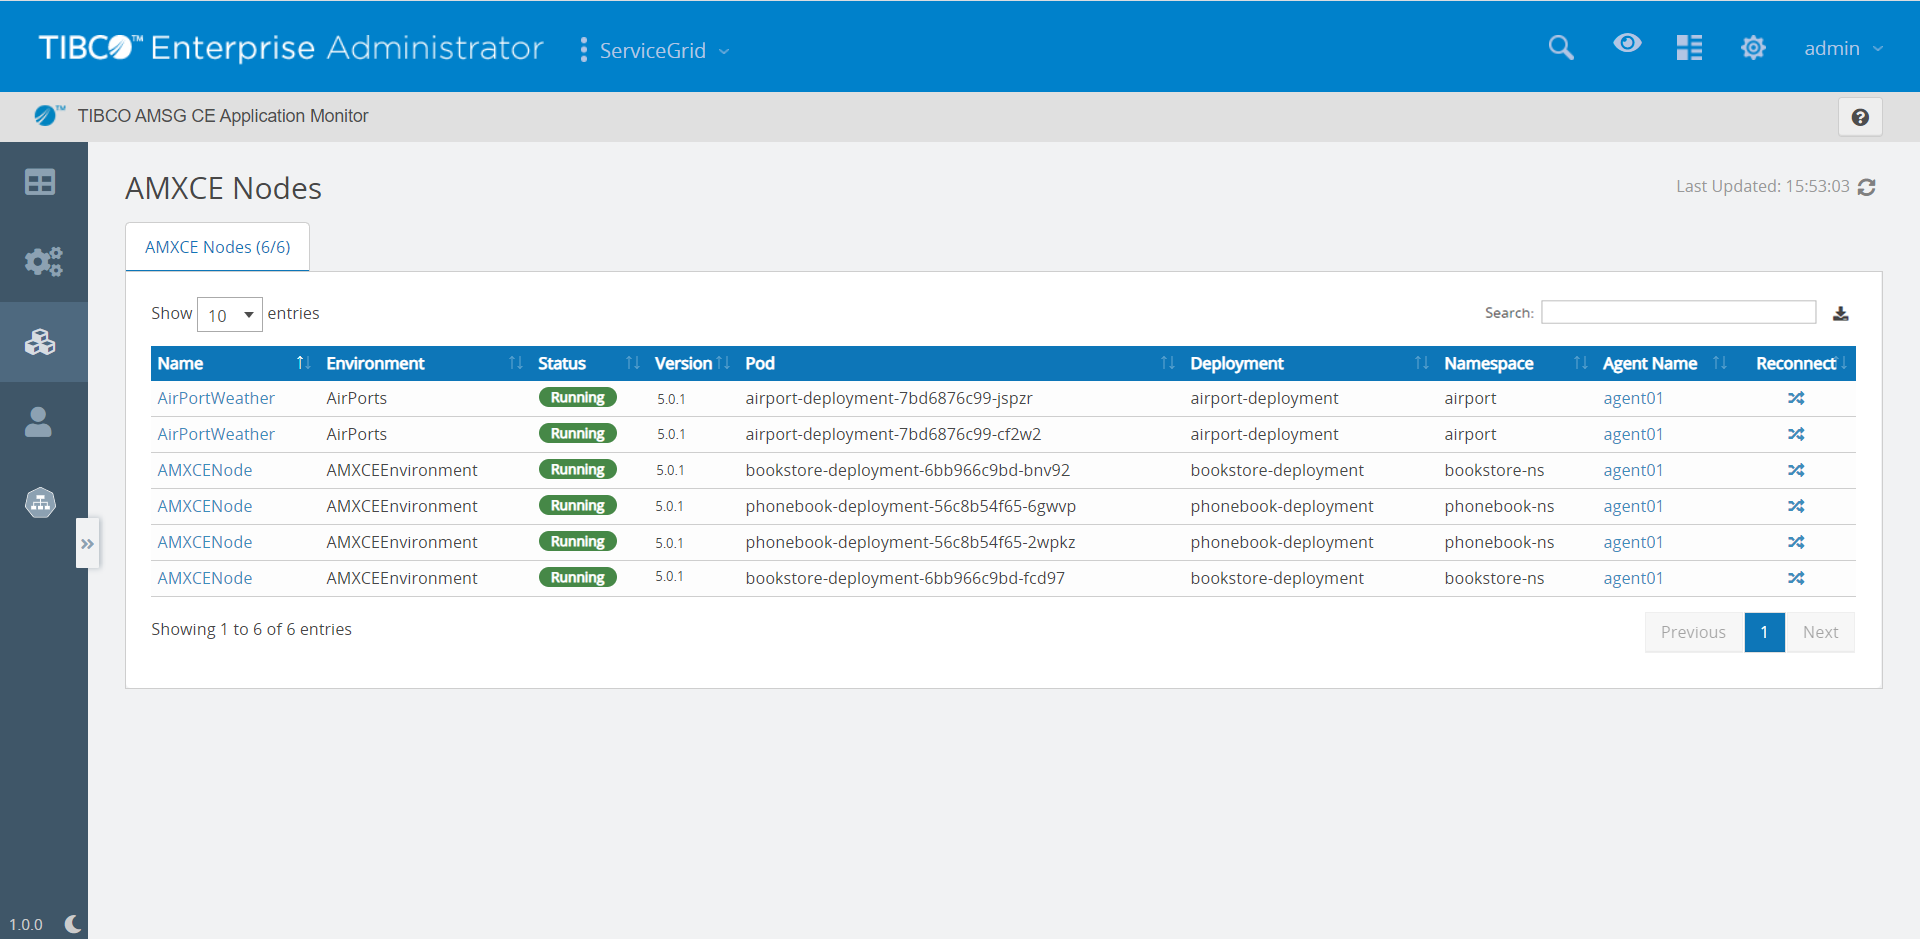
AMXCE Nodes (x/y) at the top indicates that x is the count of nodes that are registered with the Application Monitor agent and y is the number of total nodes present in the cluster. If no runtime application is deployed or no application is present in the cluster then AMXCE Nodes count is displayed as 0/NA.
| Column | Description |
|---|---|
| Name | AMXCE node name. Click the node name to view its details. |
| Environment | Name of the ActiveMatrix Service Grid - Container Edition environment in which the node is running. |
| Status |
Specifies the status of the entity. Possible values:
|
| Version | AMXCE node version. |
| Agent Name | Name of the AMXCE agent. Click the agent name to view its details. |
| Reconnect | Reconnecting involves recreating the gRPC or JMX connections from the Application Monitor to the ActiveMatrix Service Grid - Container Edition applications and refreshes the status of the AMXCE node and entities running on the node. This feature can be used to fix the inconsistent status of the Application Monitor and runtime. This reconnect operation applies to the selected node and the entities running on the selected node only. |
| The following fields are displayed for a Kubernetes setup: | |
| Pod |
Name of the pod. Pods are the smallest deployable units of computing that you can create and manage in Kubernetes. It is a group of one or more containers, with shared storage or network resources, and a specification for how to run the containers. |
| Namespace |
Name of the namespace used in the configuration ( Kubernetes supports multiple virtual clusters backed by the same physical cluster. These virtual clusters are called namespaces. Namespaces provide a scope for names.
|
| Deployment |
Name of the deployment in which the application is deployed. A deployment provides declarative updates for the pods ReplicaSets. You can describe a desired state in a deployment and the Deployment Controller changes the actual state to the desired state at a controlled rate. You can define deployments to create new ReplicaSets or to remove existing deployments and adopt all their resources with new deployments. |
You can perform the following tasks:
| Task | Description |
|---|---|
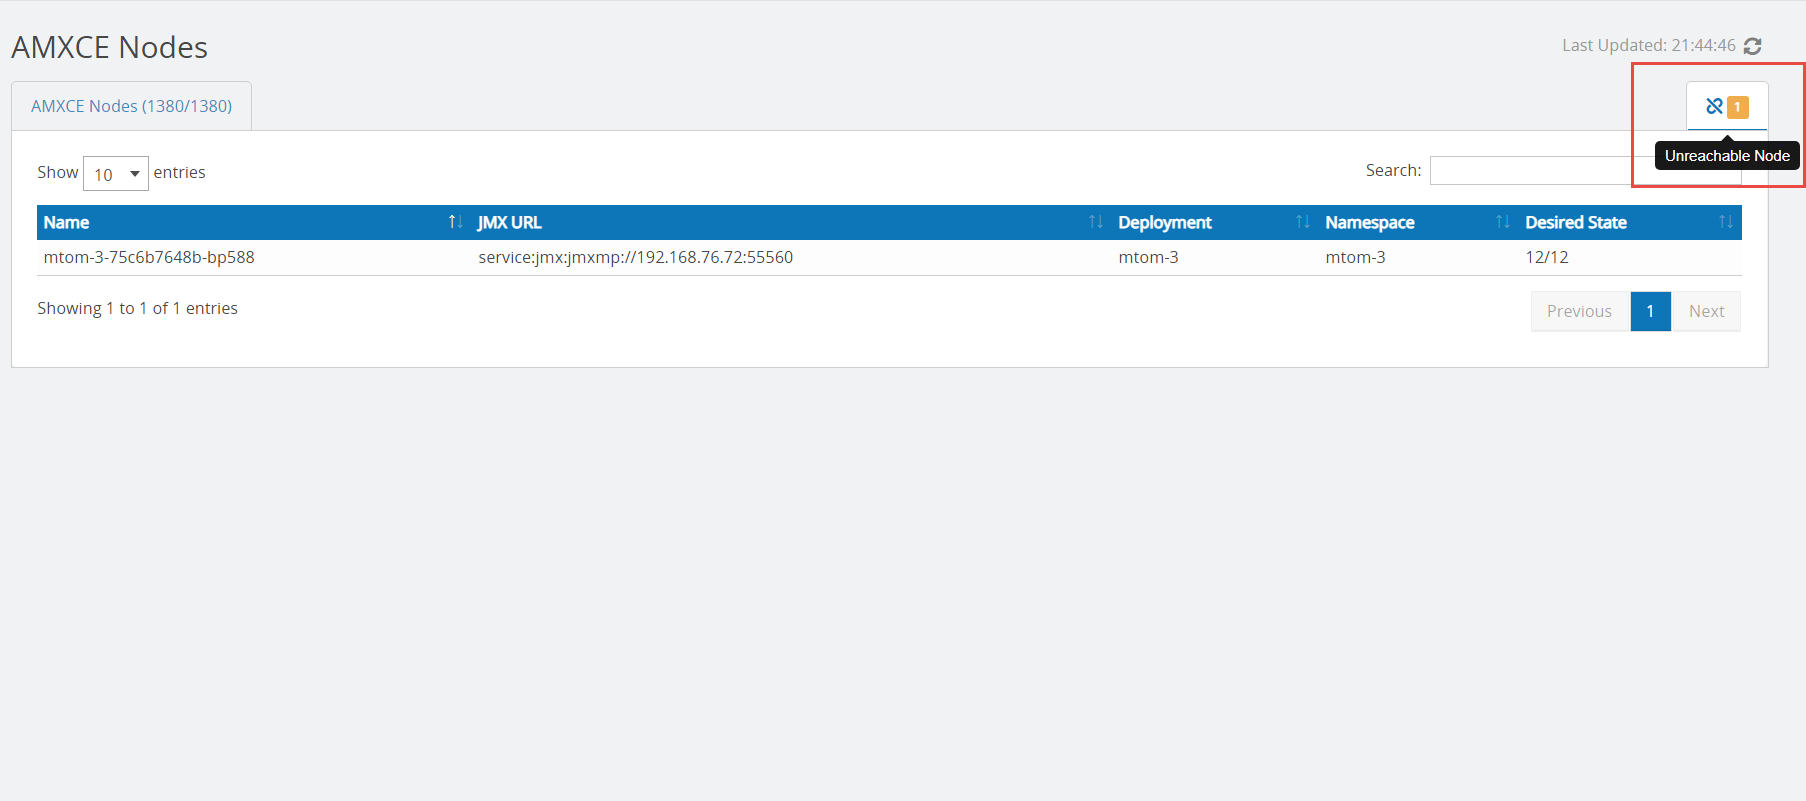
| View Unreachable Nodes |
When you start an Application Monitor TEA agent, all the AMXCE nodes are started. Sometimes, a JMX or gRPC connection cannot be created for a specific AMXCE node. To view the nodes that have not started, click the Unreachable Node icon in the upper-right corner. The count of unreachable nodes is also displayed in the upper-right corner. Unreachable Node icon is displayed only when there are one or more unreachable nodes in the cluster, otherwise, this icon is not displayed. The AMXCE node is unreachable only if the pod is running but the agent is unable to create a JMX or gRPC connection.
|
| Export JSON | To export the list of Nodes as a JSON file, click Export JSON in the upper-right corner. The name of the file gets downloaded is in the upper-right corner. The name of the file gets downloaded is AllNodes_Json_<date_time_stamp>.json. |
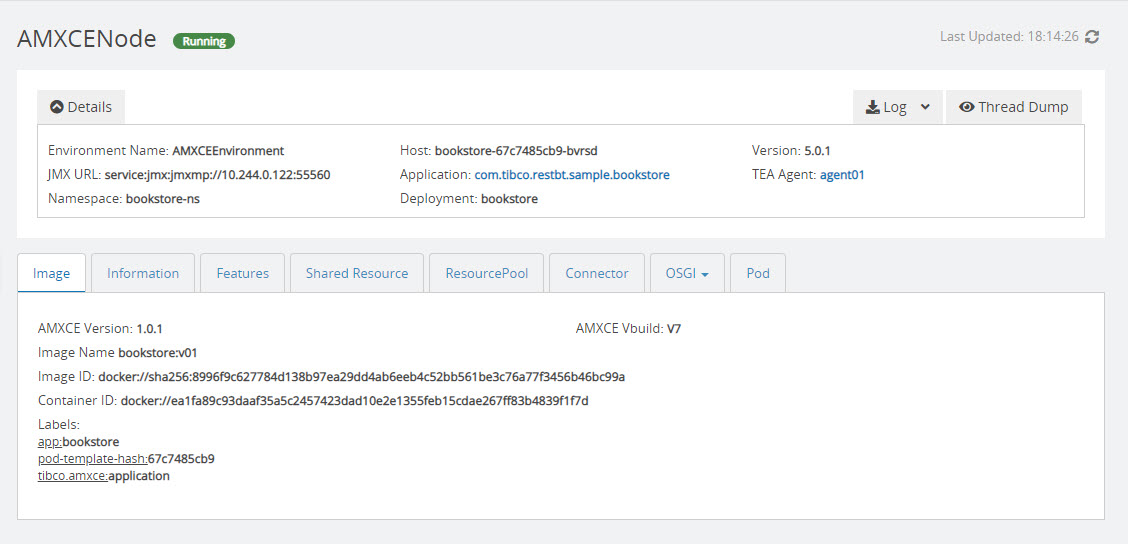
| View Node Details | On the AMXCE Nodes page, select a node to view its details. The Details pane on the node details page displays general information about the node. You can collapse and expand this pane. Click the application name to get more information about the user application running on that node. Click the TEA agent name to view its details. Host is the name of the container in which the node is running. The node details page is displayed as shown in the following image:
|
| Download Node Logs |
To download logs for a node, on the node details page, click Log File. The name of the downloaded |
| Stream Logs |
In the Log File drop-down, select Stream Logs to stream node logs in real time. Polling time is 5 seconds to fetch the latest log entries. Initially, the last 1000 lines from the logs are displayed. After that for every poll, the lines after the last received line timestamp to the current timestamp are displayed. |
| View Thread Dump |
Thread Dump captures information about threads for the node. To view Thread Dump, on the node details page, click the Thread Dump button. You can view information such as daemon thread count, thread count, peak thread count, and total started thread count. |