CPU Usage
CPU usage is a good indicator of overall system performance.
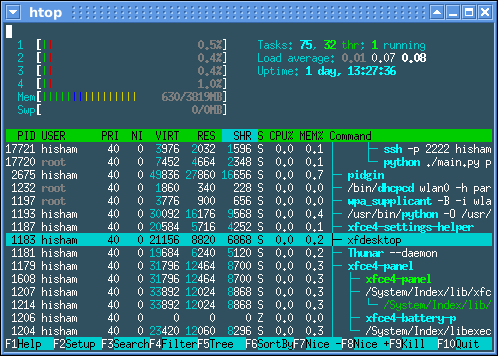
A useful text-mode interactive tool for monitoring CPU usage is htop (http://htop.sourceforge.net/index.php?page=main). This provides enhanced information that the top command does not provide.
The following table shows some example CPU usage scenarios
| Scenario | Possible Causes |
|---|---|
| High database CPU usage and low ActiveMatrix BPM usage | The database system could be underpowered for the ActiveMatrix BPM system configuration and tests being performed. It can also indicate that some SQL queries being performed are using excessive CPU, most probably due to Oracle using an incorrect execution plan for a SQL query. See Database for more detail on this. |
| Low database CPU usage and high ActiveMatrix BPM usage | If pageflows are used, it is normal for the CPU usage of the ActiveMatrix BPM system to be larger than that of the database, taking into account the relative size of each system. This can also be an indication that the JVM for the BPM nodes has run out of or is low on memory.
When a JVM runs out of heap it can spend a large amount of its time performing garbage collection in order to free up memory. This can result in high CPU usage on the ActiveMatrix BPM system, but low throughput (seen as low CPU on the database machine or slow client responses). |
| High database CPU usage and high ActiveMatrix BPM usage | The system could be working correctly, but masking other issues such as those mentioned above. If CPU is high on the ActiveMatrix BPM machine, first determine how many threads are running within the BPM node’s JVM by either: using JConsole/JVisualVM, taking a thread dump with jstack, or through Administrator (not available prior to ActiveMatrix BPM 2.2.0).
If the CPU is high and there are a large number of threads within the JVM (greater than 500), the system might be spending a lot of time context switching, which results in threads getting little actual CPU time. This can lead to slower throughput. Sometimes adding more threads can actually slow performance of a system. |
| Low database CPU usage and low ActiveMatrix BPM usage | Either the system is not being exercised by the clients enough, or there is a bottleneck somewhere in the system (for example, I/O or network).
There may also be contention for resources within the ActiveMatrix BPM nodes. For example, the number of connections in a JDBC connection pool may not be large enough, or the number of HTTP client connections insufficient. Correlate the expected performance, from the client perspective, using system monitoring (disk, CPU, and network), JVM monitoring, as well as logs from the system, database, and ActiveMatrix BPM. |