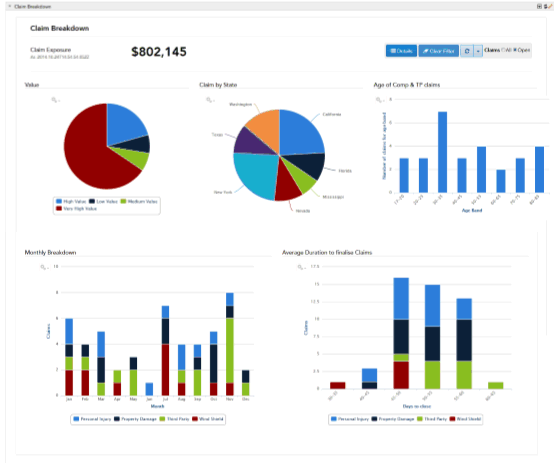
The Claim Breakdown Dashboard
The Claim Breakdown dashboard demonstrates some reports that can be generated from the case data for a case data model in the ActiveMatrix BPM case data store. The reports provide business data from the case data model used by the example Claims application. The dashboard is an HTML/JS application.

The Claim Breakdown dashboard provides a number of controls that you can use to tailor and filter the dashboard data.
The following table describes the reports used in the Claim Breakdown dashboard.
| Report | Description |
|---|---|
| Claim Exposure | Shows the total value of the claims at the indicated timestamp. |
| Value | Shows the number of claims broken down by value band.
If you click a specific value band, the dashboard redraws all the other reports to show the data for the selected value band, and updates the dashboard title accordingly. |
| Claim By State | Shows the number of claims broken down by state.
If you click a specific state, the dashboard redraws all the other reports to show the data for the selected state, and updates the dashboard title accordingly. |
| Age of Comp & TP Claims | Shows the number of claims broken down by age band of the driver.
If you click a specific age band, the dashboard redraws all the other reports to show the data for the selected age band, and updates the dashboard title accordingly. |
| Monthly Breakdown | Shows the number of claims in the current claims selection, broken down by month and by type. |
| Average Duration to finalise Claims | Shows the average number of days taken to close claims in the current claims selection, broken down by claim type. |
The following table describes the additional reports provided in the Claim Hot list.
Two versions of the Claim Breakdown dashboard are provided - Openspace gadget and standalone.
Openspace Gadget Version
You can access this dashboard when you are logged in to Openspace, as any user.
The dashboard demonstrates how you can use ActiveMatrix BPM web services to access information about a particular case (in this example, a claim) from the case data store in one report, and then use that information in another report to extract and display statistical data about the case (in this example, about the current process instance and work item) from the BPM database. See Displaying Process Status (Statistical Data) for a Particular Claim (Case Data)for more information.
Standalone version
You can access this dashboard in any web browser, using the URL:
http://host:port/openspace/jaspershowcase/claimdashboard_sa.html
where:
- host is the DNS name of the server hosting the BPM runtime.
- port is the port being used by Openspace. The default value is 8080.
If JasperReports Server is hosted remotely and/or is using a different port, you must update these default URLs by adding a path parameter in the following format:
?jasperserver=http://host:port/jasperserver-pro
where:

 to manually refresh each report on the dashboard.
 to display the