Creating a Table to Display the Data
In this task, create a table to display the data from the data set that you created previously. You start by inserting a table element, then you insert data elements in the table.
Procedure
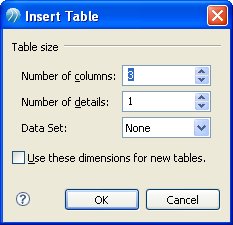
- From the Palette, drag a table element onto the report. Click OK in the following dialog to create a three column table:
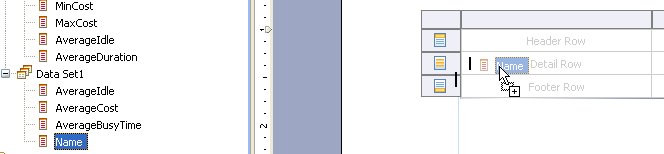
- Drag the Name from the Data Explorer to the detail row of the first column of the table:
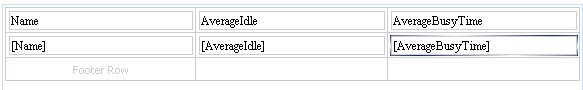
- Similarly drag AverageIdle and AverageBusyTime to the detail rows of the second and third columns. The header rows are filled in automatically and the table looks like this:
Copyright © Cloud Software Group, Inc. All rights reserved.