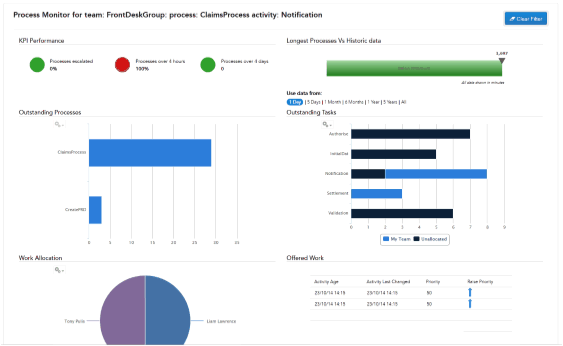
The Process Monitor dashboard demonstrates some Jaspersoft reports that can be generated from the central event database tables in the ActiveMatrix BPM database. The reports provide statistical information about processes, work items and user activity. The dashboard is an HTML/JS application.

The following table describes the reports used in the Process Monitor dashboard.
| Report
|
Description
|
| Key Performance Indicators
|
Displays statistical information for the outstanding processes on your BPM system:
- the percentage of processes that have been escalated
- the percentage of processes that are over 4 hours old
- the number of processes that are over 4 days old
|
| Longest Processes vs Historic Data
|
This report displays:
- how the average process completion time has improved (or degenerated) over the time period. (All data is shown in minutes.)
- how the process is behaving currently.
The colored bar illustrates how your process has behaved historically. It calculates the average period of time and maximum period of time that your processes took to complete for a given time period. You can select the time period from the
Use data from area of the report. The triangular markers show how the longest process currently on your system compares to the historic data.
|
| Outstanding Processes
|
Displays all the outstanding processes on the system and how many outstanding process instances there are for each process. If you select an individual process, the dashboard redraws all the other reports to show the data for the selected process and updates the dashboard title accordingly.
|
| Outstanding Tasks
|
This report shows different information depending on which version of the dashboard you are using.
Openspace gadget
The report displays the outstanding tasks for all the outstanding processes on the system. If you have selected a process in the Outstanding Processes report, it only displays the outstanding tasks for the selected process.
It shows how the outstanding tasks are distributed between
My Team (depending on whether you are logged in as Leon Court or Richard Cresswell),
Unallocated (the outstanding tasks that are not allocated to an organizational entity) or
Other (the outstanding tasks that are allocated to other teams in the organization).
Standalone
The report displays the outstanding tasks for all the outstanding processes on the system. If you have selected a process in the Outstanding Processes report, it only displays the outstanding tasks for the selected process. It shows how the outstanding tasks are distributed between the different work item states.
|
| Work Allocation
|
This report shows different information depending on which version of the dashboard you are using.
Openspace gadget
Displays how the outstanding tasks that are allocated to the team are distributed between individual team members. By default, it shows all the outstanding tasks but if you select a task from the Outstanding Tasks report, the data is filtered for the selected outstanding task (and the dashboard title updated accordingly).
Standalone
This reports shows how the outstanding tasks are distributed between the different work item states. If you selected a task in the Outstanding Tasks report, it shows the work distribution for the selected task and updates the dashboard title accordingly.
|
| Work
|
The information displayed in this report depends on what you have selected in the Work Allocation report. The information shown is different depending on which version of the dashboard you are using.
Openspace gadget
If you selected a team member in the Work Allocation report, information displays about the work activity for that team member. The type of information shown is the age of the activity, the date and time there was last activity on that task and its priority. You can also raise the priority of the activity.
Standalone
If you selected Allocated, the report displays information about the activities that are allocated. The type of information shown is the age of the activity, the date and time there was last activity on that task and its priority.
|
Note: You can select
Clear Filter to clear your filters at any time.
Two versions of the Process Monitor dashboard are provided - Openspace gadget and standalone.
Openspace Gadget Version
You can access this dashboard when you are logged in to Openspace as one of the team leaders, Richard Cresswell or Leon Court.
Note: If you try to view this dashboard when logged in as any other user - for example,
tibco-admin - you will see a
This user is not a manger of a team, cannot display dashboard error. To give the user access to this dashboard you must assign a value of FrontDeskGroup or BackDeskGroup to their TeamName resource attribute. See
Mapping Users from the EasyAs LDAP Source to the Claims Organization Model for more information.
The dashboard demonstrates how you can use ActiveMatrix BPM web services to:
Standalone Version
You can access this dashboard in any web browser, using the URL:
http://host:port/openspace/jaspershowcase/jaspershowcase_sa.html
where:
- host is the DNS name of the server hosting the BPM runtime.
- port is the port being used by Openspace. The default value is 8080.
If JasperReports Server is hosted remotely and/or is using a different port, you must add a path parameter to the URL, in the following format:
?jasperserver=http://host:port/jasperserver-pro
where:
- host is the hostname of the machine that is hosting JasperReports Server.
- port is the port number being used by JasperReports Server.
Note: Using the standalone version of the dashboard, you cannot filter the data based on the logged in user's team membership or increase a work item's priority.
Copyright © Cloud Software Group, Inc. All rights reserved.

