| diagram | 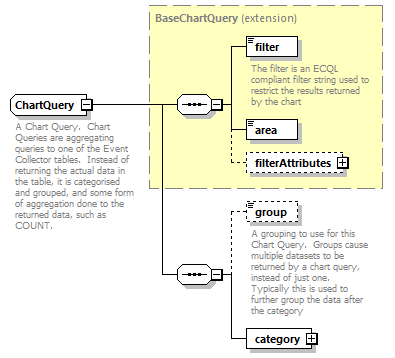 |
||
| namespace | http://base.api.ec.n2.tibco.com | ||
| type | extension of BaseChartQuery | ||
| properties |
|
||
| children | filter area filterAttributes group category | ||
| annotation |
|
||
| source | <xs:complexType name="ChartQuery"> <xs:annotation> <xs:documentation>A Chart Query. Chart Queries are aggregating queries to one of the Event Collector tables. Instead of returning the actual data in the table, it is categorised and grouped, and some form of aggregation done to the returned data, such as COUNT.</xs:documentation> </xs:annotation> <xs:complexContent> <xs:extension base="BaseChartQuery"> <xs:sequence> <xs:element name="group" type="xs:string" minOccurs="0" maxOccurs="1"> <xs:annotation> <xs:documentation>A grouping to use for this Chart Query. Groups cause multiple datasets to be returned by a chart query, instead of just one. Typically this is used to further group the data after the category</xs:documentation> </xs:annotation> </xs:element> <xs:element name="category" type="ChartCategory" minOccurs="1" maxOccurs="1"/> </xs:sequence> </xs:extension> </xs:complexContent> </xs:complexType> |
element ChartQuery/group
| diagram | 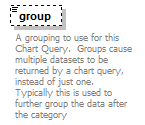 |
||||||
| type | xs:string | ||||||
| properties |
|
||||||
| annotation |
|
||||||
| source | <xs:element name="group" type="xs:string" minOccurs="0" maxOccurs="1"> <xs:annotation> <xs:documentation>A grouping to use for this Chart Query. Groups cause multiple datasets to be returned by a chart query, instead of just one. Typically this is used to further group the data after the category</xs:documentation> </xs:annotation> </xs:element> |
element ChartQuery/category
| diagram | 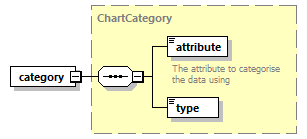 |
||
| type | ChartCategory | ||
| properties |
|
||
| children | attribute type | ||
| source | <xs:element name="category" type="ChartCategory" minOccurs="1" maxOccurs="1"/> |
WSDL documentation generated by XMLSpy WSDL Editor http://www.altova.com/xmlspy