Displaying the Dashboards
Procedure
- Select .
-
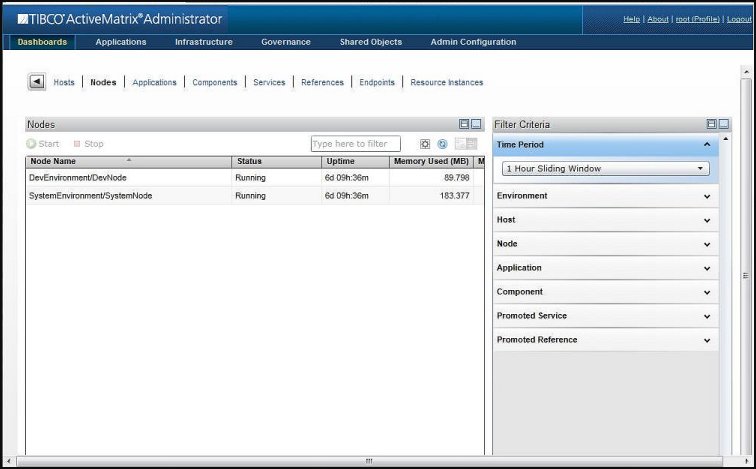
In the Filter Criteria gadget on the right:
- Click the Time Period drop-down list and select a time period. The time period affects averages and counts, but not metrics with an explicit last value such as Uptime. Basic monitoring provides one hour and since started time periods.
- Click
 next to a category to display the available objects in the category and select one or more objects.
The items displayed in the table on the left are filtered by the selected time period and objects.
Copyright © Cloud Software Group, Inc. All rights reserved.