How to Analyze Your BPM Data Using TIBCO Spotfire
The BPM Spotfire template visualizations illustrate a typical use case scenario for a bank. Typically, a bank wants information about its current operation.
For example, current work and how to prioritize and organize resources. Secondly, a bank wants to know its performance over time. For example, how do processes perform end to end and how much time is spent on each task. This, in turn, helps the bank to address issues such as what activities are taking the most time and how can that time be shortened.
The BPM Spotfire templates help to visualize this information. Therefore, the BPM Spotfire Templates are divided into two categories:
Operational
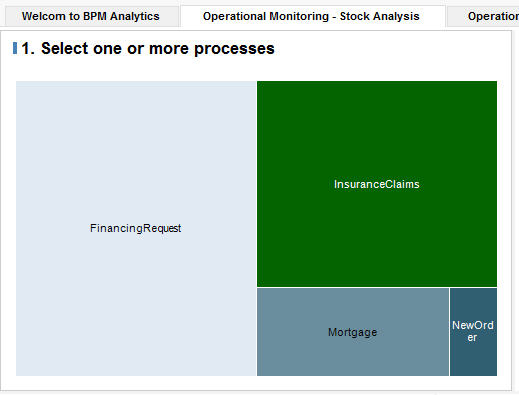
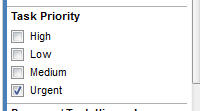
- Operational Monitoring - This visualization allows you to select a process, a task within that process, and its priority and then view how long it has been outstanding, whether there are any approaching SLAs (service level agreements), what resources are working on it.
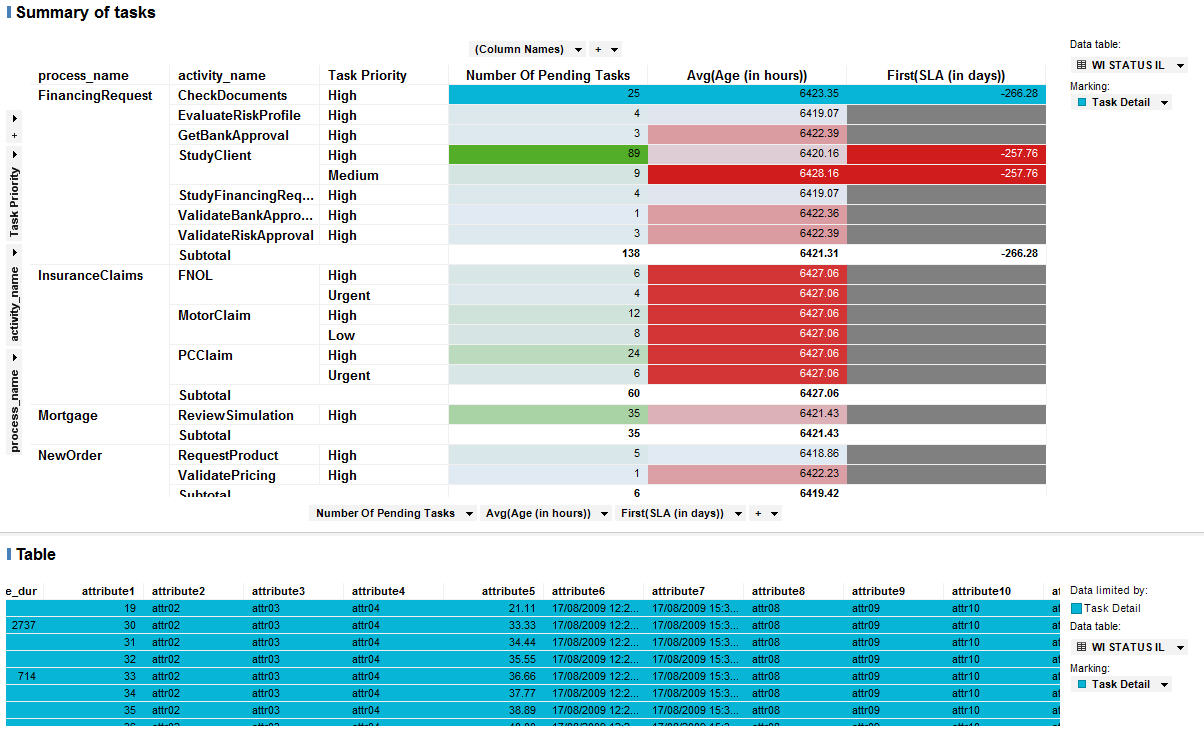
- Operational Summary - This visualization displays a summary of all tasks from all processes. It shows the outstanding tasks, their average duration and their first SLA.
Performance
There are three visualizations in this category:
- Performance Tasks - This template allows you to select a task and then displays:
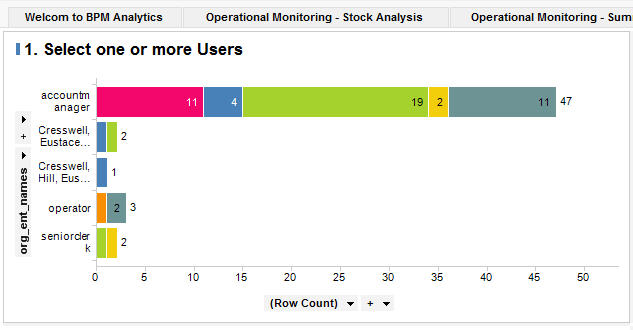
- Performance Resources - This template allows you to select one or more resources and a time period. It then displays what tasks those resources has been working on and the duration of those tasks.
- Process Analysis - This template allows you to select a process. It then displays how many process instances there have been for that process and their duration.
Depending on your requirements, you may want to use the visualizations as they are or isolate the data further by coloring different segments, or creating filters and so on. This tutorial shows you how to modify the visualizations so you can compare the data in new ways.
Before starting this tutorial, you must have completed the Pre-Requisites.
This tutorial shows you how to re-analyze the data in each visualization, depending on your requirements. You can: