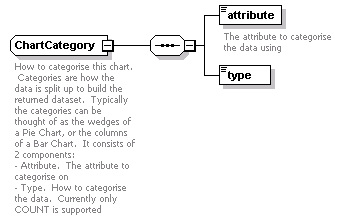
| diagram |  |
||
| namespace | http://base.api.ec.n2.tibco.com | ||
| children | attribute type | ||
| used by |
|
||
| annotation |
|
||
| source | <xs:complexType name="ChartCategory"> <xs:annotation> <xs:documentation>How to categorise this chart. Categories are how the data is split up to build the returned dataset. Typically the categories can be thought of as the wedges of a Pie Chart, or the columns of a Bar Chart. It consists of 2 components: - Attribute. The attribute to categorise on - Type. How to categorise the data. Currently only COUNT is supported</xs:documentation> </xs:annotation> <xs:sequence> <xs:element name="attribute" type="xs:string" minOccurs="1" maxOccurs="1"> <xs:annotation> <xs:documentation>The attribute to categorise the data using</xs:documentation> </xs:annotation> </xs:element> <xs:element name="type" type="ChartCategoryType" minOccurs="1" maxOccurs="1"/> </xs:sequence> </xs:complexType> |
WSDL documentation generated by XMLSpy WSDL Editor http://www.altova.com/xmlspy