Ping TIBCO ActiveMatrix Entities in Real Time
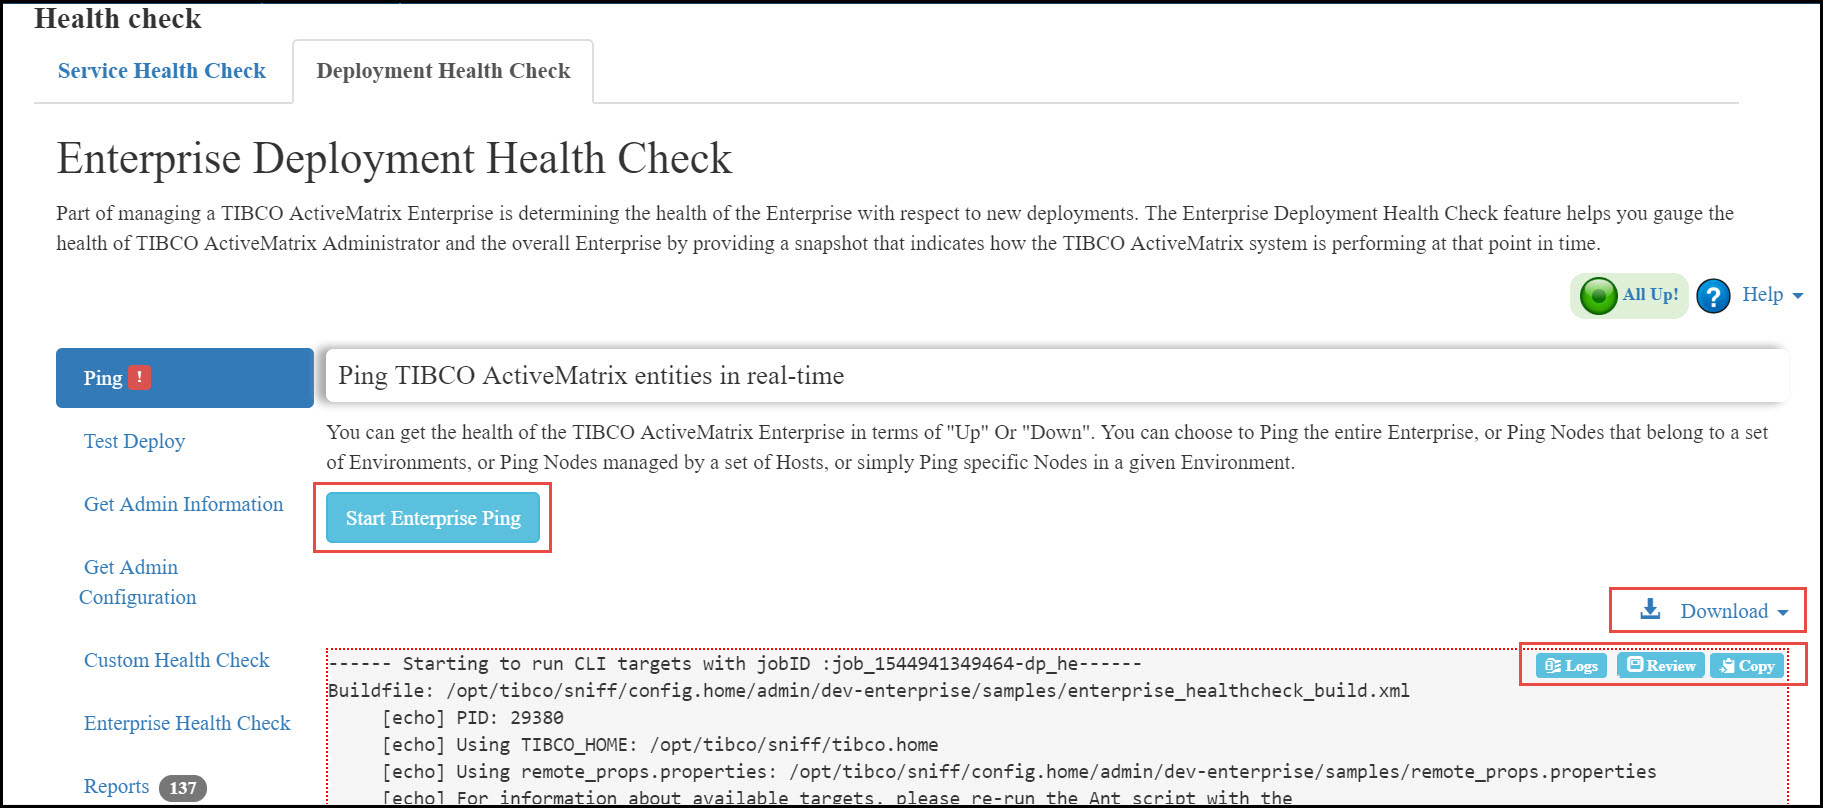
You can check the health of the TIBCO ActiveMatrix enterprise in terms of "Up" Or "Down" using Ping. This test runs Ping for entire enterprise including hosts and nodes.
Click the Start Enterprise Ping button to ping TIBCO ActiveMatrix enterprise. The output of ANT script is streamed in the output area. You can view the time taken to ping each entity in the output area. If there is any error or failure, output area is highlighted with red outline as shown in the following image.
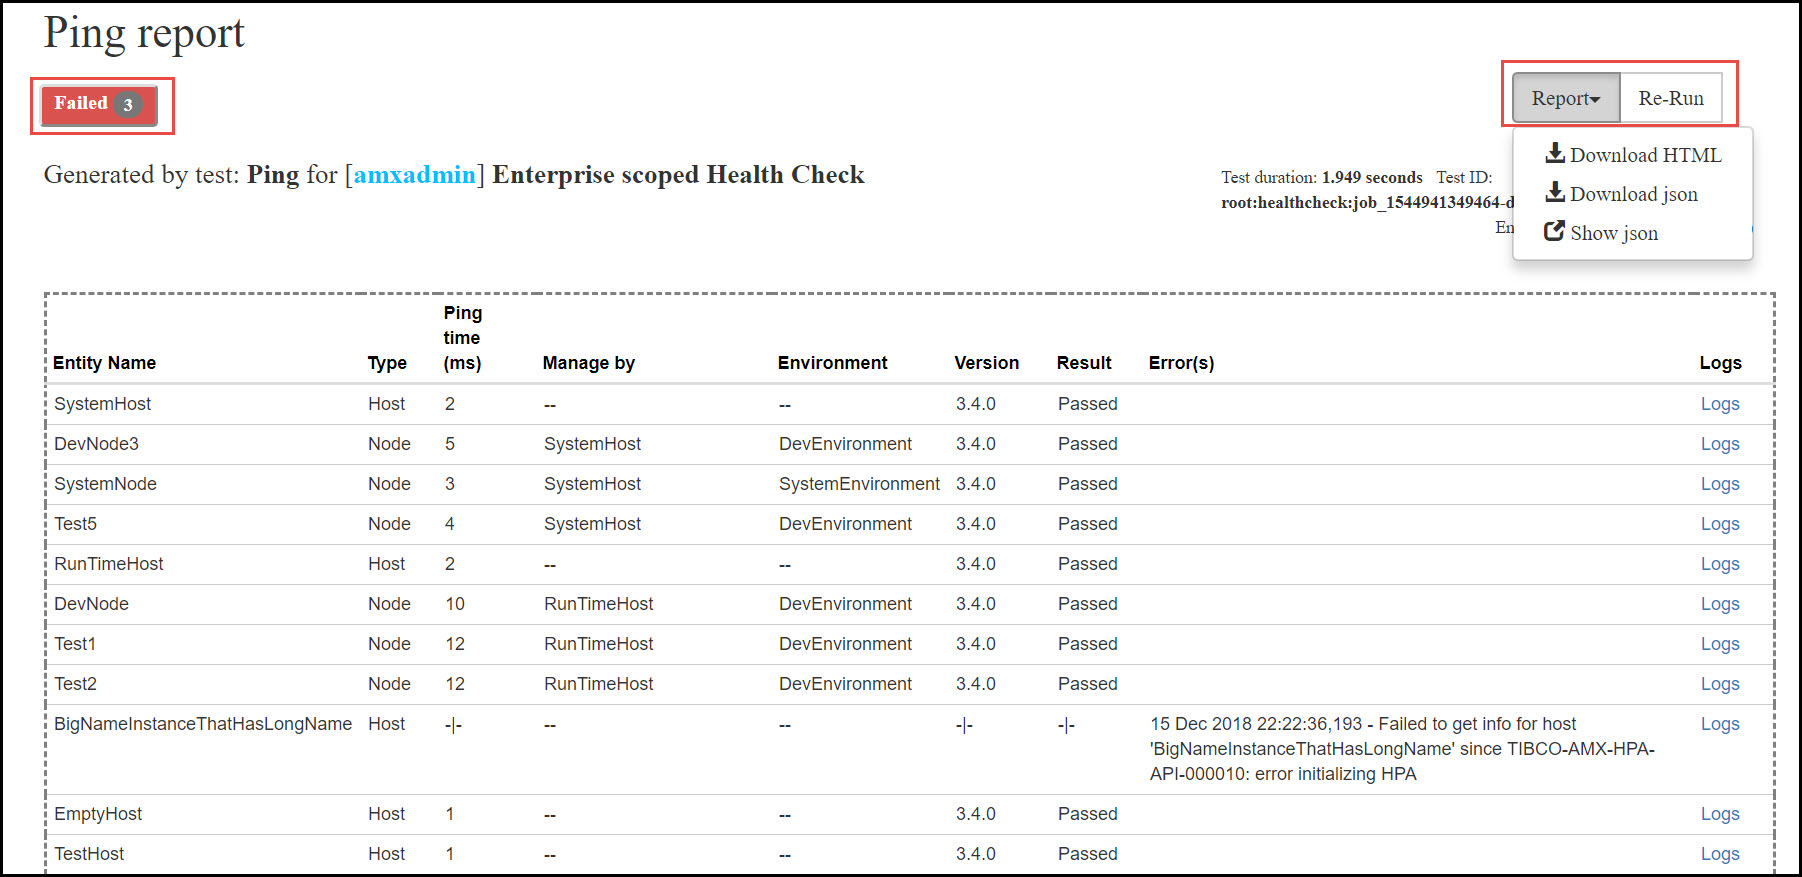
- To see the report as an HTML page, click the Review button in the upper-right corner of output area. The report is displayed in a new browser tab. You can download the report in an HTML or JSON format using Report button on the page. You can rerun the test by clicking Re-Run button.
- You can copy the output of the ANT script to a clipboard using Copy button.
- To download logs of host and nodes that participated in the health check, click Logs button.
- You can download the following reports and output from
Download button in the top right corner:
- Console output
- JSON report
- Logs of hosts and nodes involved in the test
- Both console output or JSON report as .zip file
Sample output URL: http://show-amx:8120/amxadministrator/GetEdhcFiles?jobID=job_1544694401842-dp_he&asText=true&fileType=out
Ping Report
| Column | Description |
|---|---|
| Entity name | Name of host or node |
| Ping time (milliseconds) | Time taken to ping host or node |
| Result | Whether the host or node is up (Passed) or if it is not running (Failed) |
| Errors | Description of the error that has occurred when running the Ping health check. |
| Logs | You can download logs for the host and node participated in the Ping test by clicking relevant link in the Logs column. |
For failed tests, you can view the errors by clicking Failed button in upper-left corner as shown in the following image.