Runtime Information of TIBCO ActiveMatrix Administrator (Collected in Real-time)
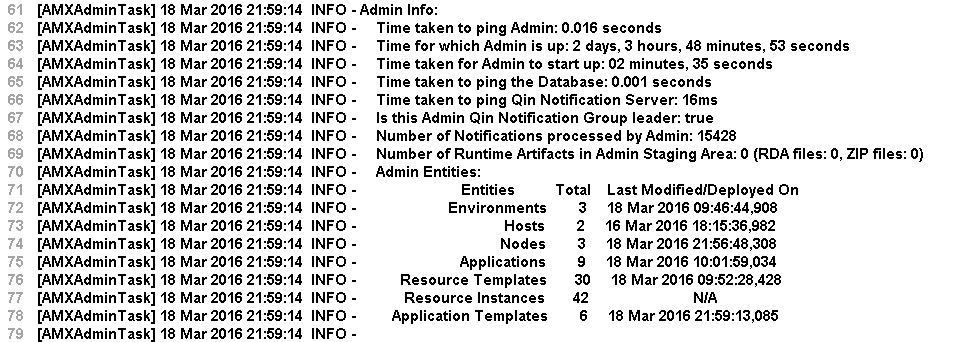
Above CLI Output snippet shows the runtime information of TIBCO ActiveMatrix Administrator, collected in real-time as Enterprise Deployment Health Check was being executed, notably:
- Time taken to ping the TIBCO ActiveMatrix Administrator (the CLI JVM that runs the Enterprise Deployment Health Check is also a client to the TIBCO ActiveMatrix Administrator).
- Time for which the TIBCO ActiveMatrix Administrator is up.
- Time taken for the TIBCO ActiveMatrix Administrator to start (this includes the time taken to start the web application of the TIBCO ActiveMatrix Administrator that is deployed on SystemNode).
- Time taken for the TIBCO ActiveMatrix Administrator to ping the backend database.
- Time taken for the TIBCO ActiveMatrix Administrator to ping the Notification/Qin server.
- Whether or not the TIBCO ActiveMatrix Administrator is responsible for processing all the Qin notifications, denoted by “is a Qin leader”.
- Number of Qin notifications processed by the TIBCO ActiveMatrix Administrator since restart.
- Number of Runtime artifacts pending in the TIBCO ActiveMatrix Administrator staging area yet to be delivered to or processed by the TIBCO ActiveMatrix Runtime.
- Listing of the Entities organized by type, detailing the count and when the Entity was Deployed or Last Modified.
Depending on the selection of the “Options” targets, the runtime information may not be in the CLI output. For example, if you run Enterprise Deployment Health Check as follows, the runtime information is not shown:
ant -f enterprise_healthcheck_build.xml do.ping health.ent
or
ant -f enterprise_healthcheck_build.xml test.deploy he
If a report file is generated at the end of Enterprise Deployment Health Check invocation, it contains detailed information related to above output under the <adminInfo> element.
Copyright © Cloud Software Group, Inc. All rights reserved.