Response: Graphical Representation on UI
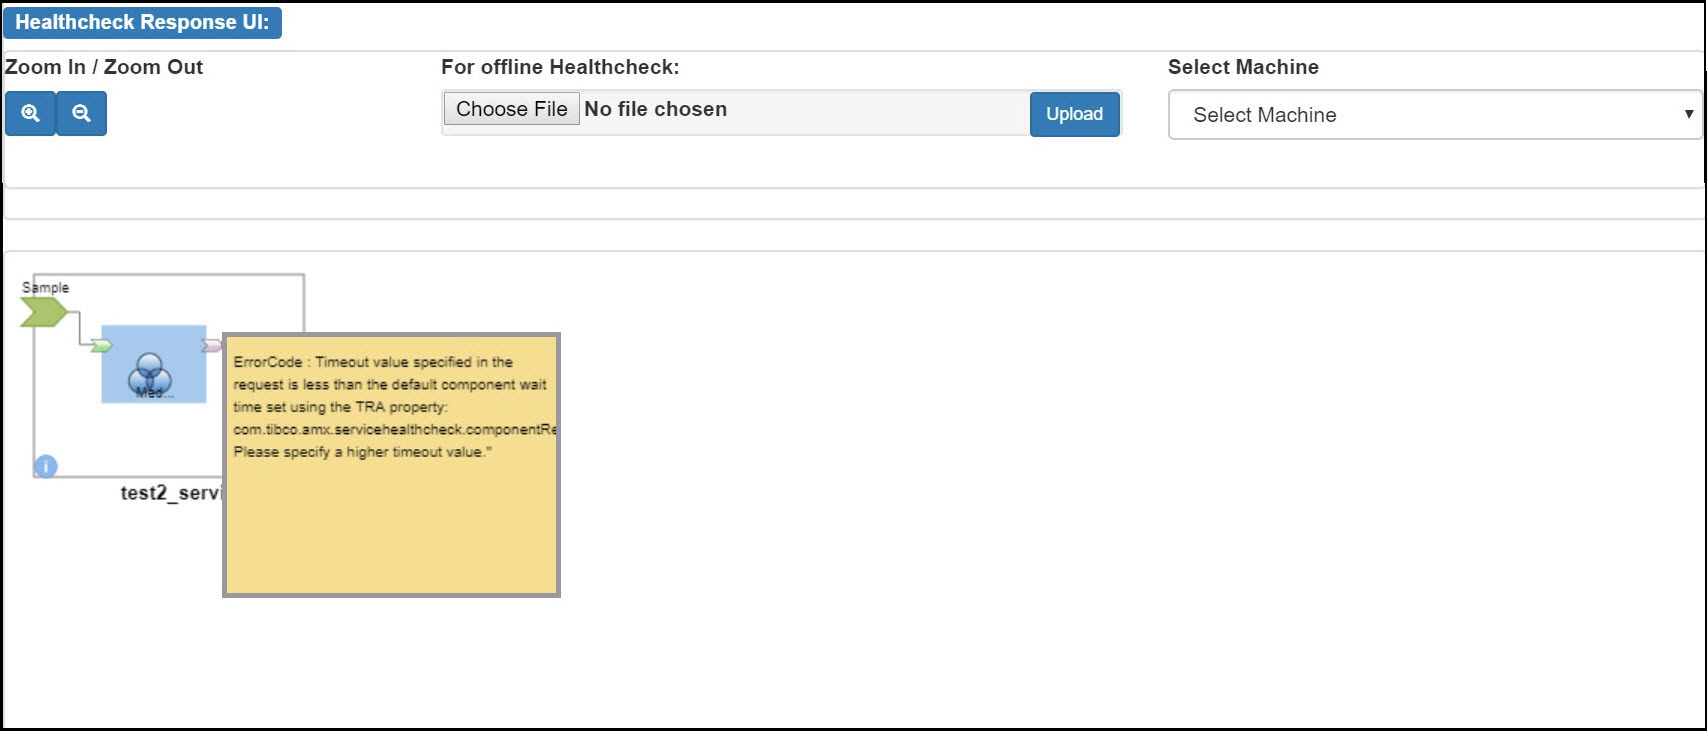
In the Health Check Response UI section the Service Health Check Response is displayed in a graphical format and indicates the message flow across a chain of Applications.
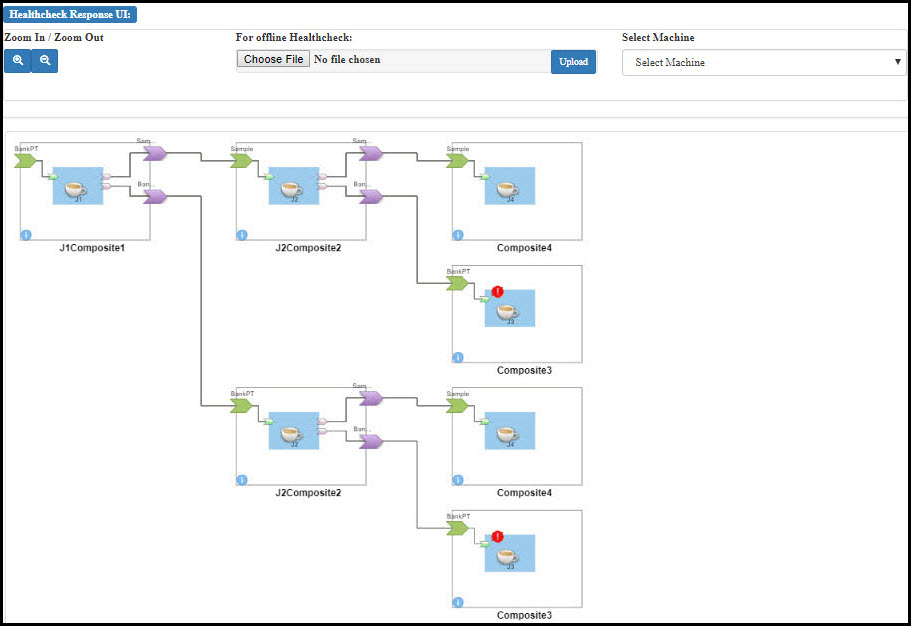
You can perform the following actions from the UI:
- Click the Zoom-in and Zoom-out icons to magnify canvas image for better readability.
- Scroll through the graphical representation by mouse drag (especially in case of long Application chains).
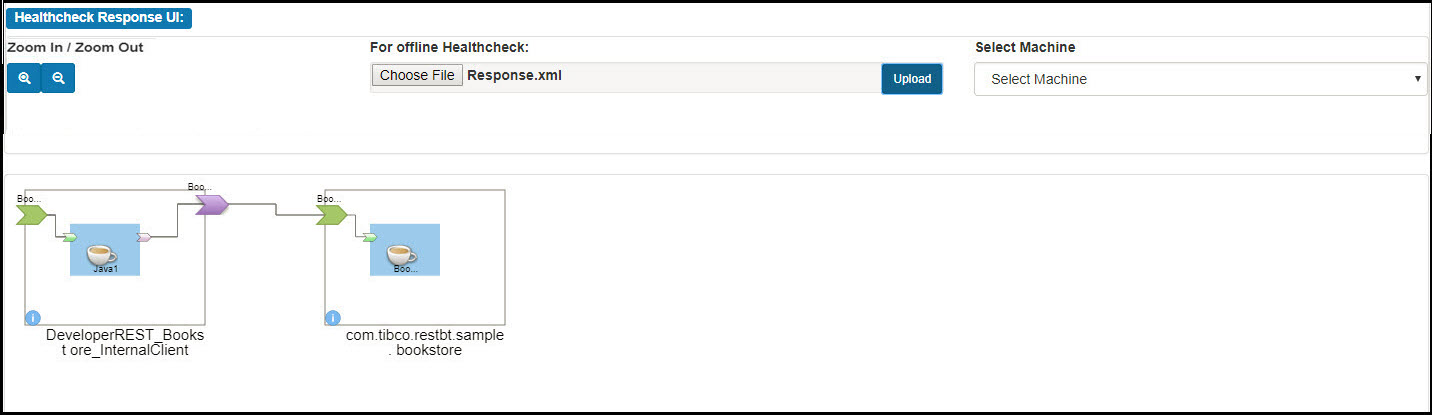
- Choose an existing XML response captured from prior Service Health Check invocations and click Upload. A graphical representation of the uploaded response is displayed.
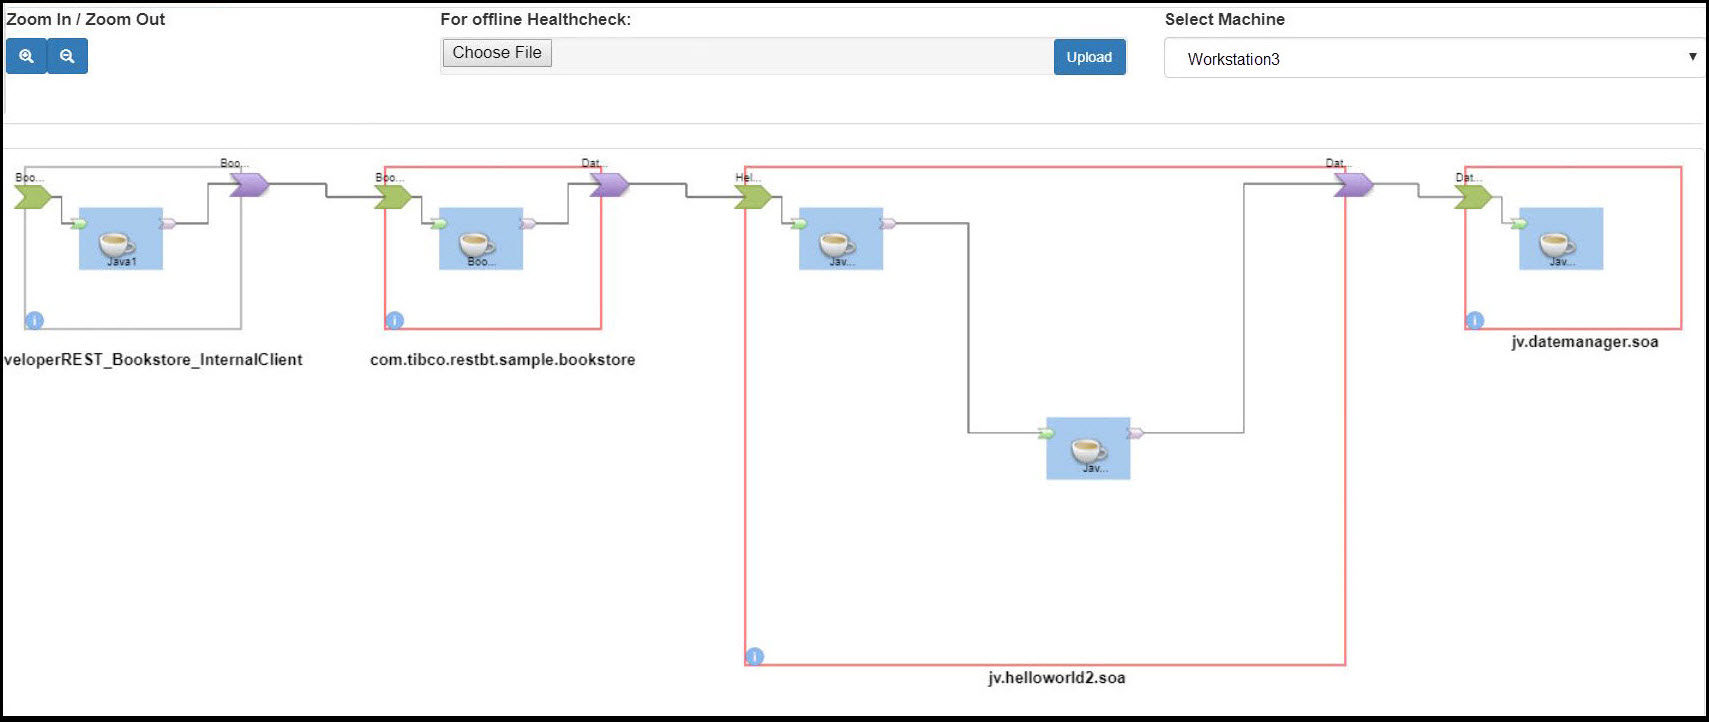
- If Applications are distributed on different machines, select a machine from the Select Machine list. The Applications on the selected machine are highlighted in the graphical representation.
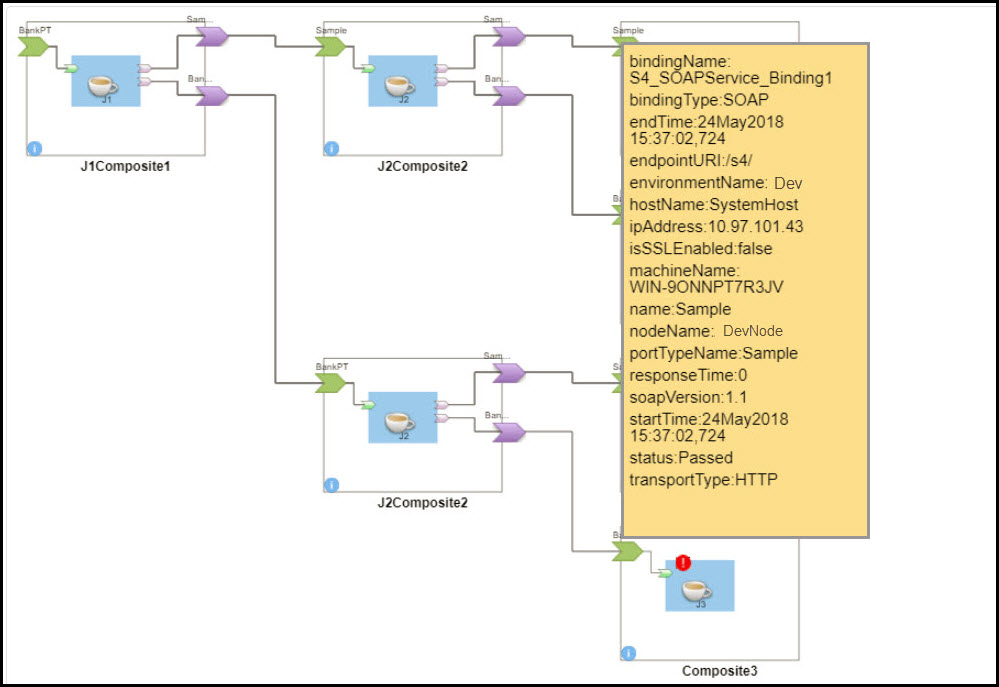
- Hover over a Service for details such as Binding name, Binding type, Environment name and Host name. For more information about elements and attributes in a response, see Elements and Attributes in a response.
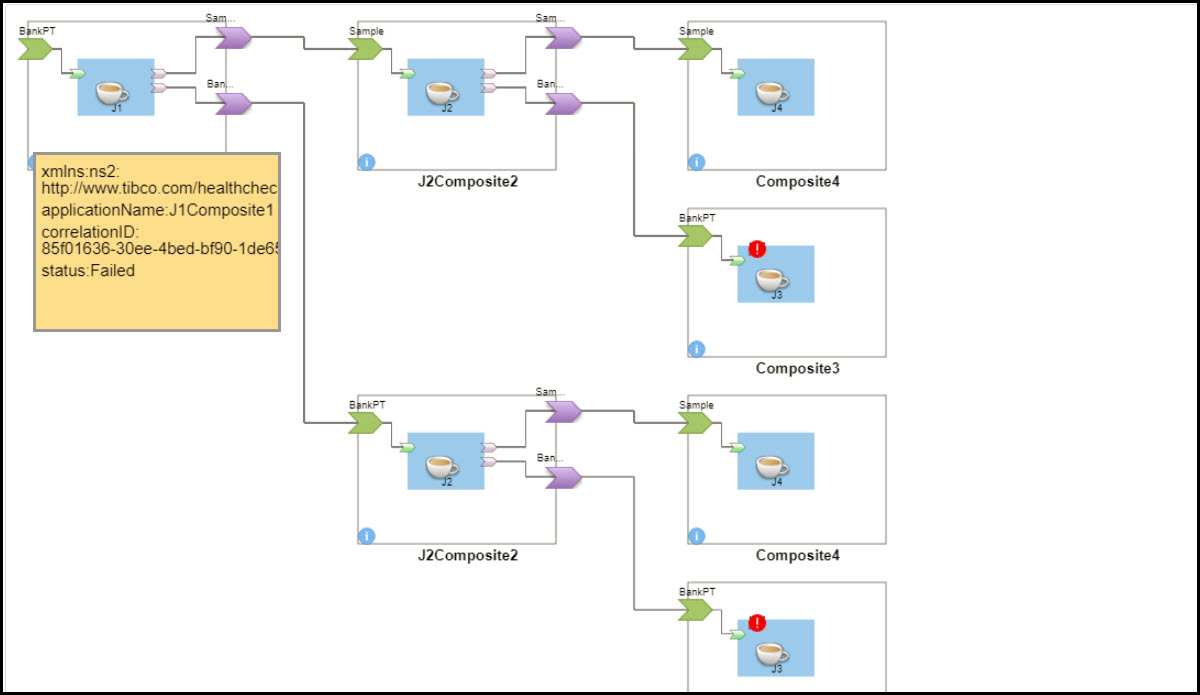
- Hover over
 icon inside the Application for details such as Application name, Correlation ID and Status.
- If the Service Health Check path is broken or there is an error on the path, it will be highlighted by the
 icon. Hovering over the icon displays additional details.
Copyright © Cloud Software Group, Inc. All rights reserved.