Customer Traffic Detail Reports
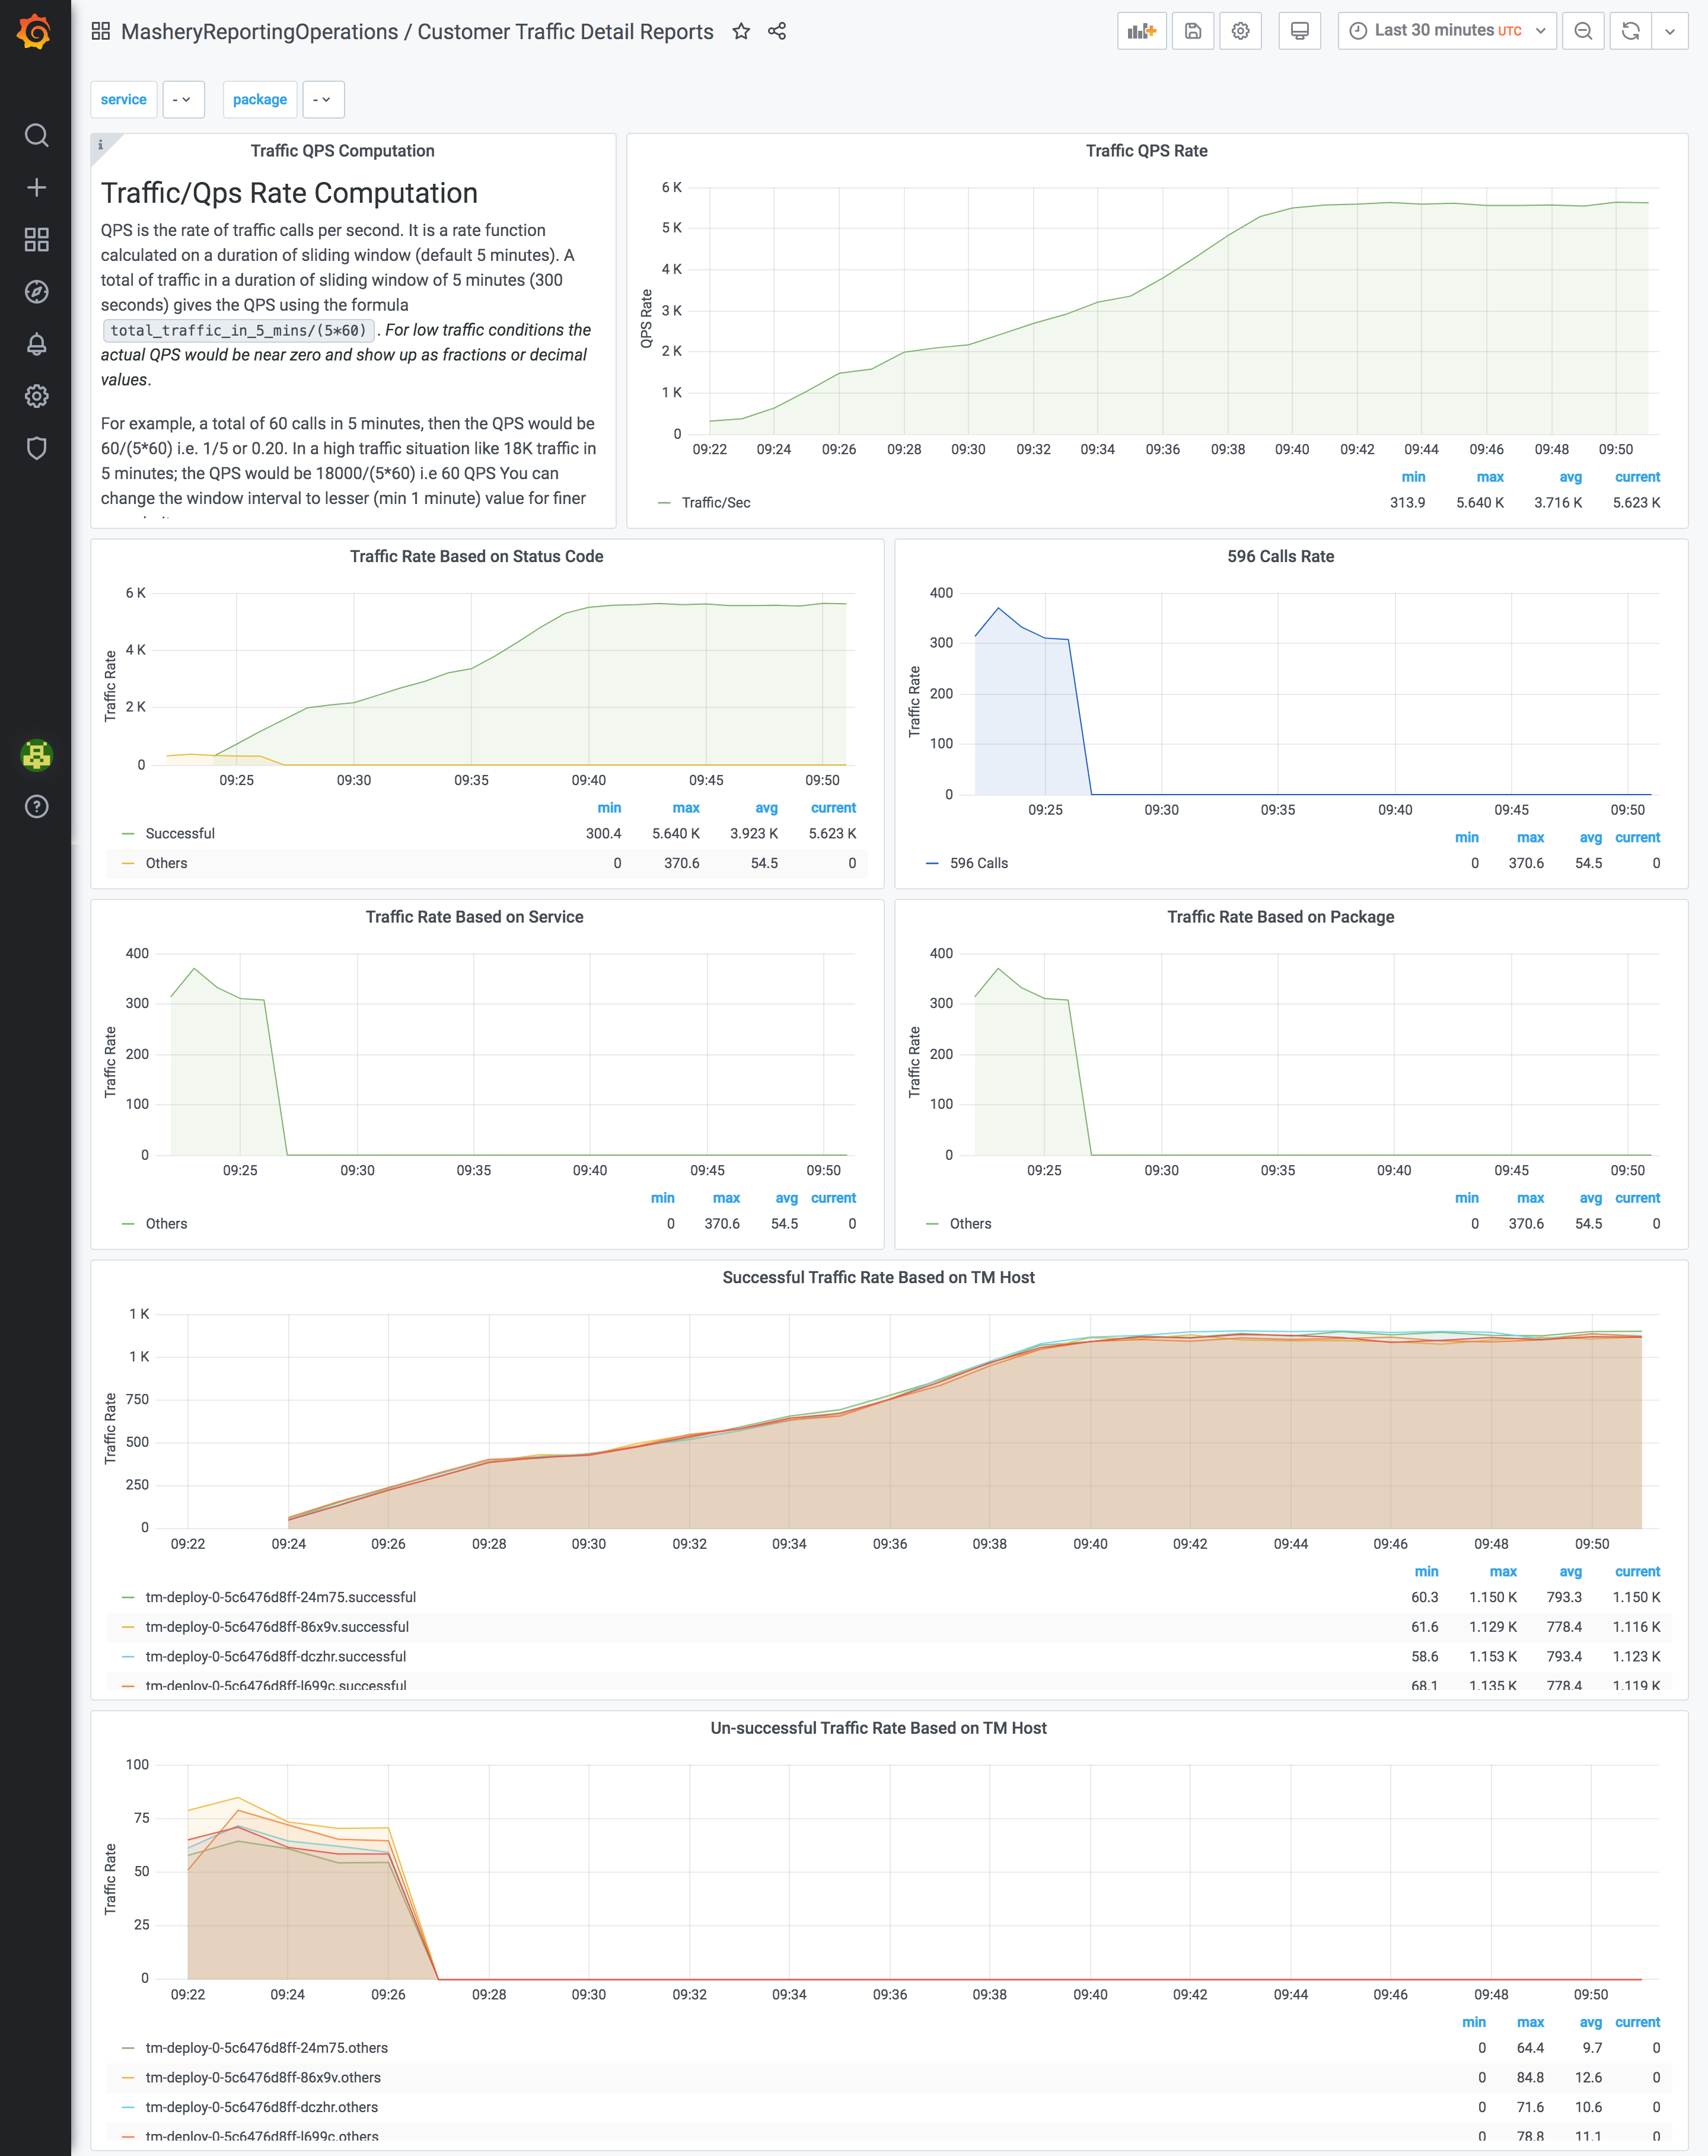
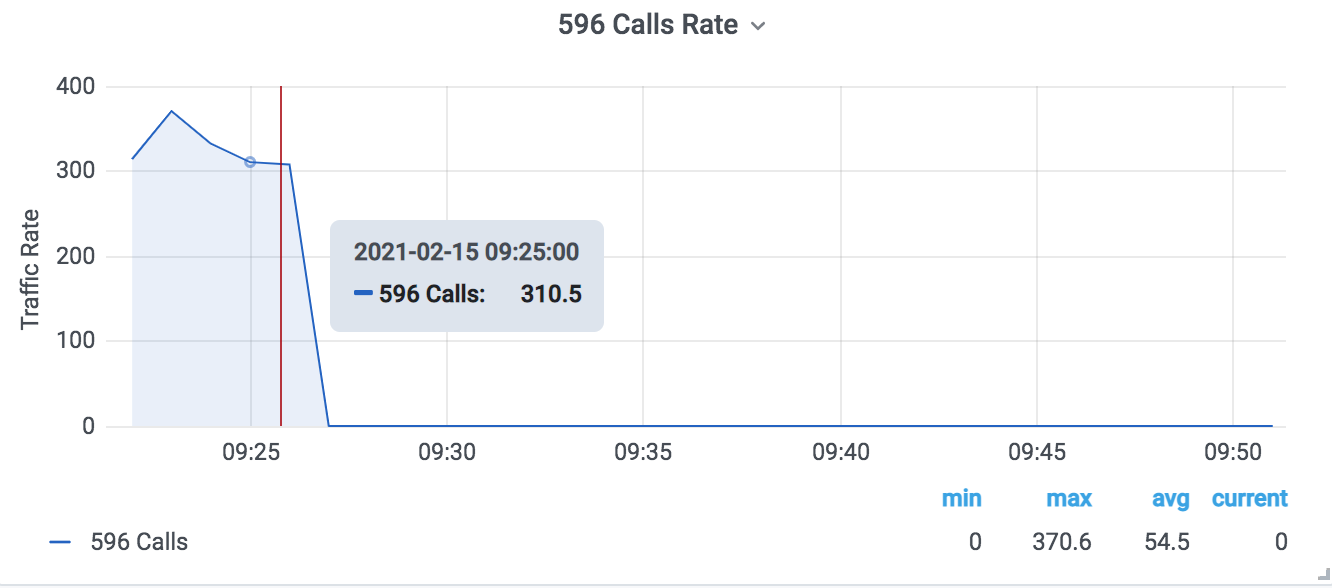
The Customer Traffic Detail Reports page displays charts and graphs based on traffic rate handled by each traffic manager, services, packages, and response code. This gives insight into the health of traffic serviced by the tml-cluster so that you can get details about the usage of each service and package. You also get details on the rate of successful calls per package, service, and traffic manager.
Traffic QPS
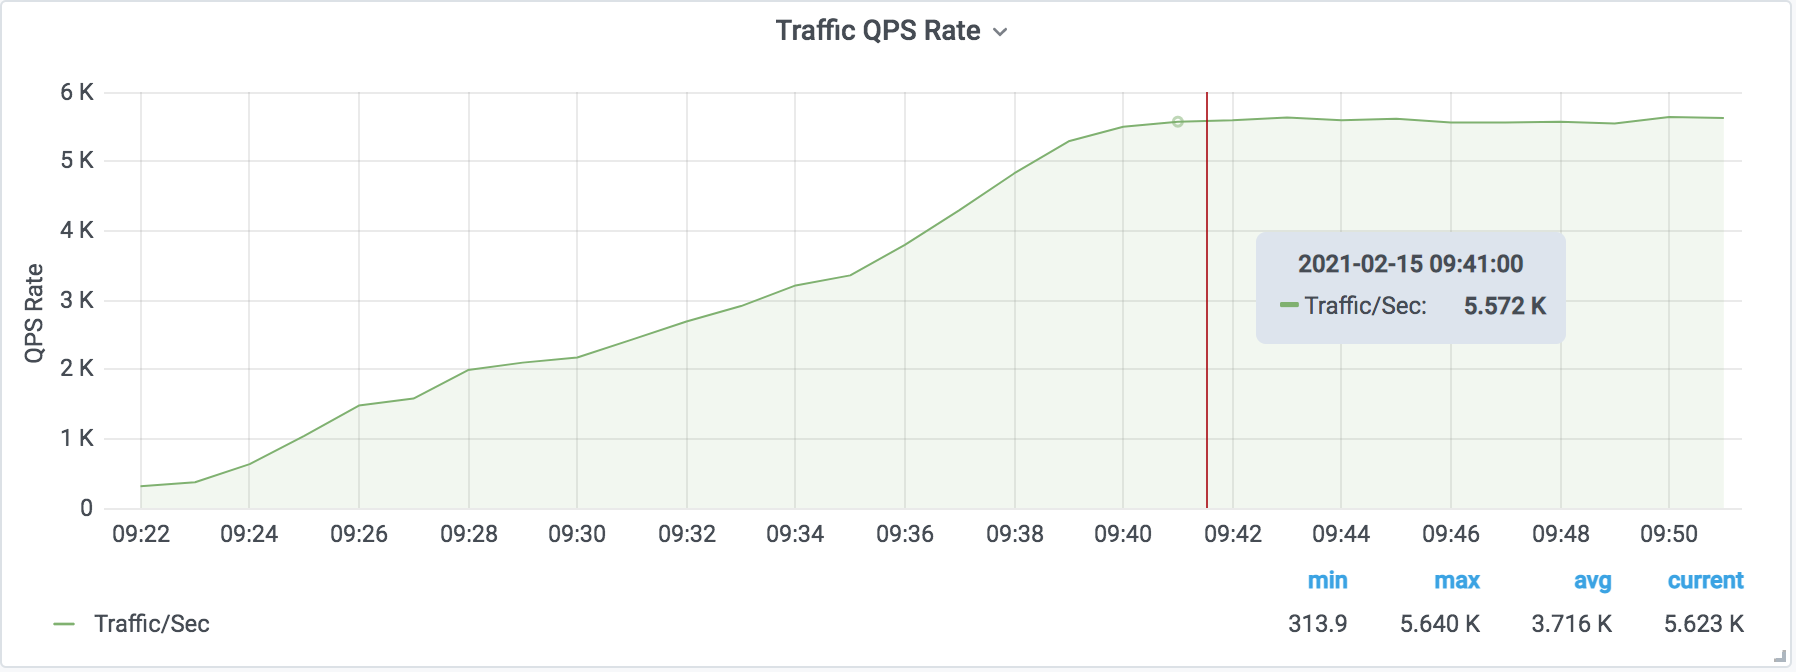
The Traffic QPS graph displays the rate of traffic handled per second calculated over a bucket of 5 minutes. Data points are plotted at an interval of 60 seconds. This graph gives the overall traffic handled in the tml-cluster so that you can monitor the traffic QPS for the time selected on the dashboard.
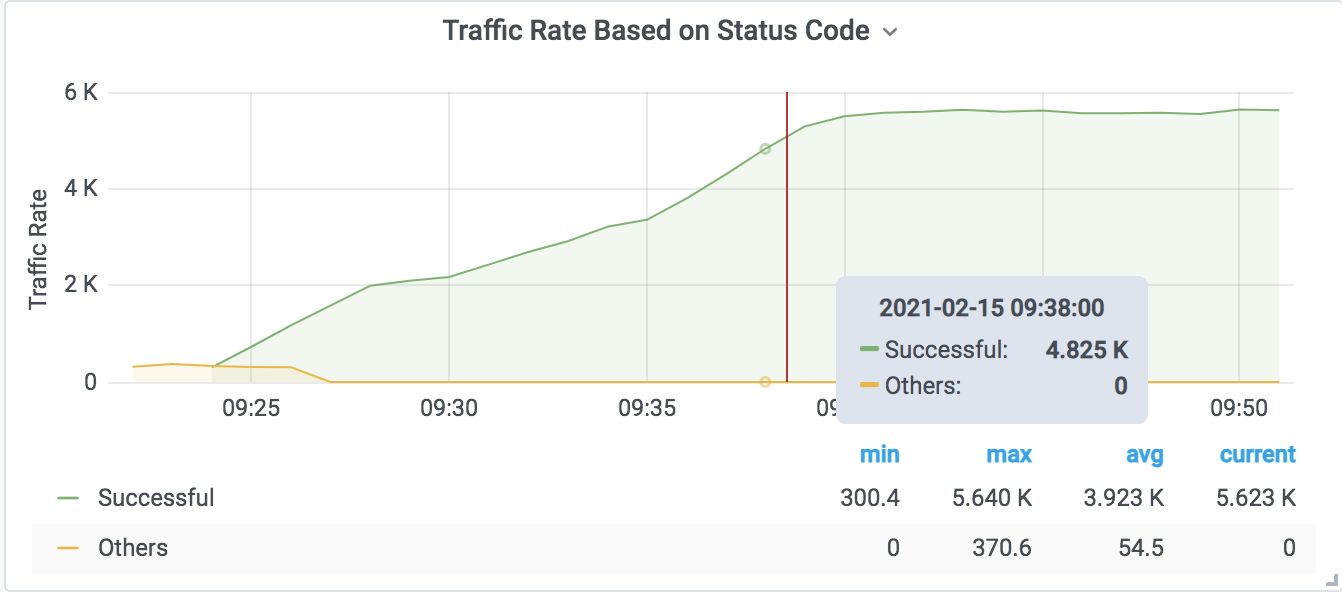
Traffic Based On Status Code
- Successful: This displays the rate of traffic call per second for the status code 200 over a bucket of 5 minutes.
- Blocked: This displays the rate of traffic call per second for the status code ranging from 400 to 499 over a bucket of 5 minutes.
- Others: This displays the rate of traffic call per second for the status code other than the above two conditions over a bucket of 5 minutes.
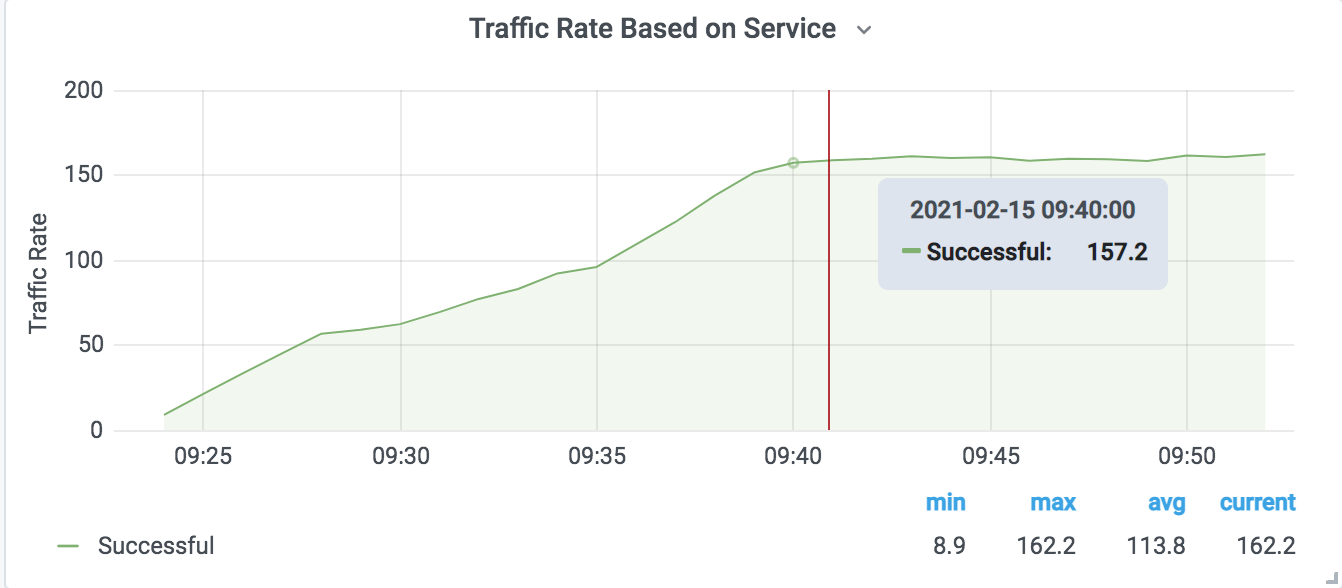
Traffic based on Service
- Successful: This displays the rate of traffic call per second for the status code 200 over a bucket of 5 minutes.
- Blocked: This displays the rate of traffic call per second for the status code ranging from 400 to 499 over a bucket of 5 minutes.
- Others: This displays the rate of traffic call per second for the status code other than the above two conditions over a bucket of 5 minutes.
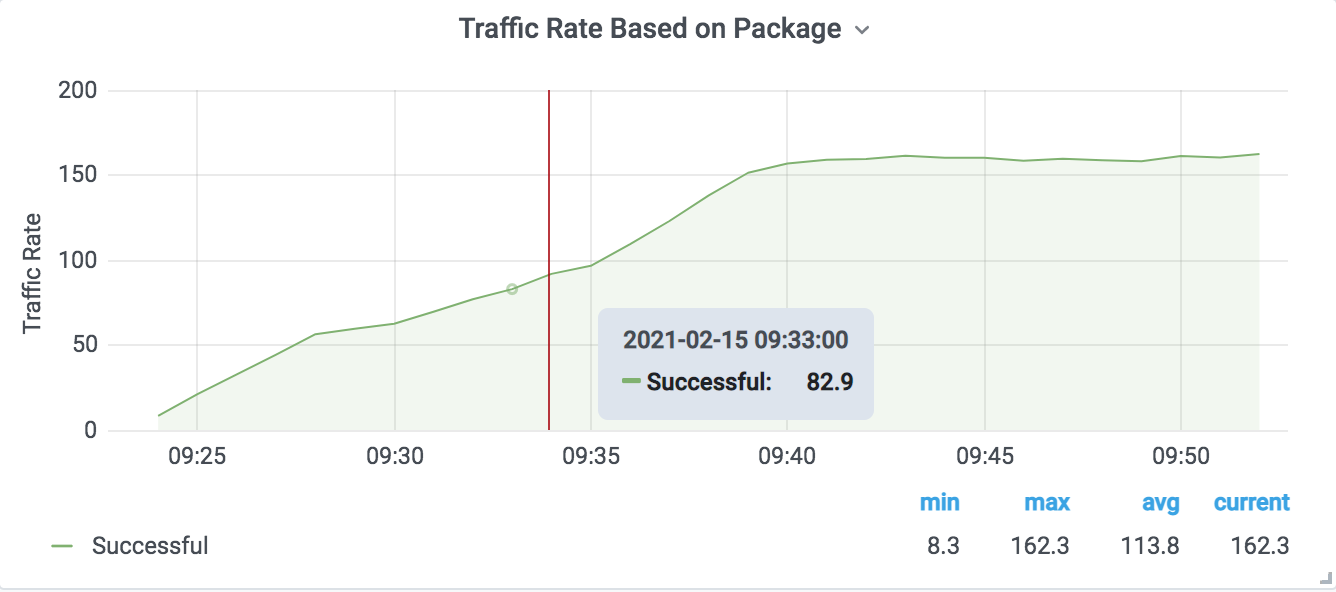
Traffic based on Package
- Successful: This displays the rate of traffic call per second for the status code 200 over a bucket of 5 minutes.
- Blocked: This displays the rate of traffic call per second for the status code ranging from 400 to 499 over a bucket of 5 minutes.
- Others: This displays the rate of traffic call per second for the status code other than the above two conditions over a bucket of 5 minutes.
Successful Traffic based on Traffic Manager Host
The
Successful Traffic based On Traffic Manager Host graph displays the rate of successful traffic calls (for example, traffic call with status code 200) per tml-tm pod/container over a bucket of 5 minutes. This helps identify the load pattern across the tml-tm component and also identifies any traffic manager that is having trouble serving traffic.

Unsuccessful Traffic based On Traffic Manager Host
The
Unsuccessful Traffic based On Traffic Manager Host graph displays the rate of unsuccessful traffic calls (for example, traffic call with status code other than 200) per tml-tm pod/container over a bucket of 5 minutes. This helps identify any traffic manager processing a large number of unsuccessful calls.

