TML Reporting Metrics
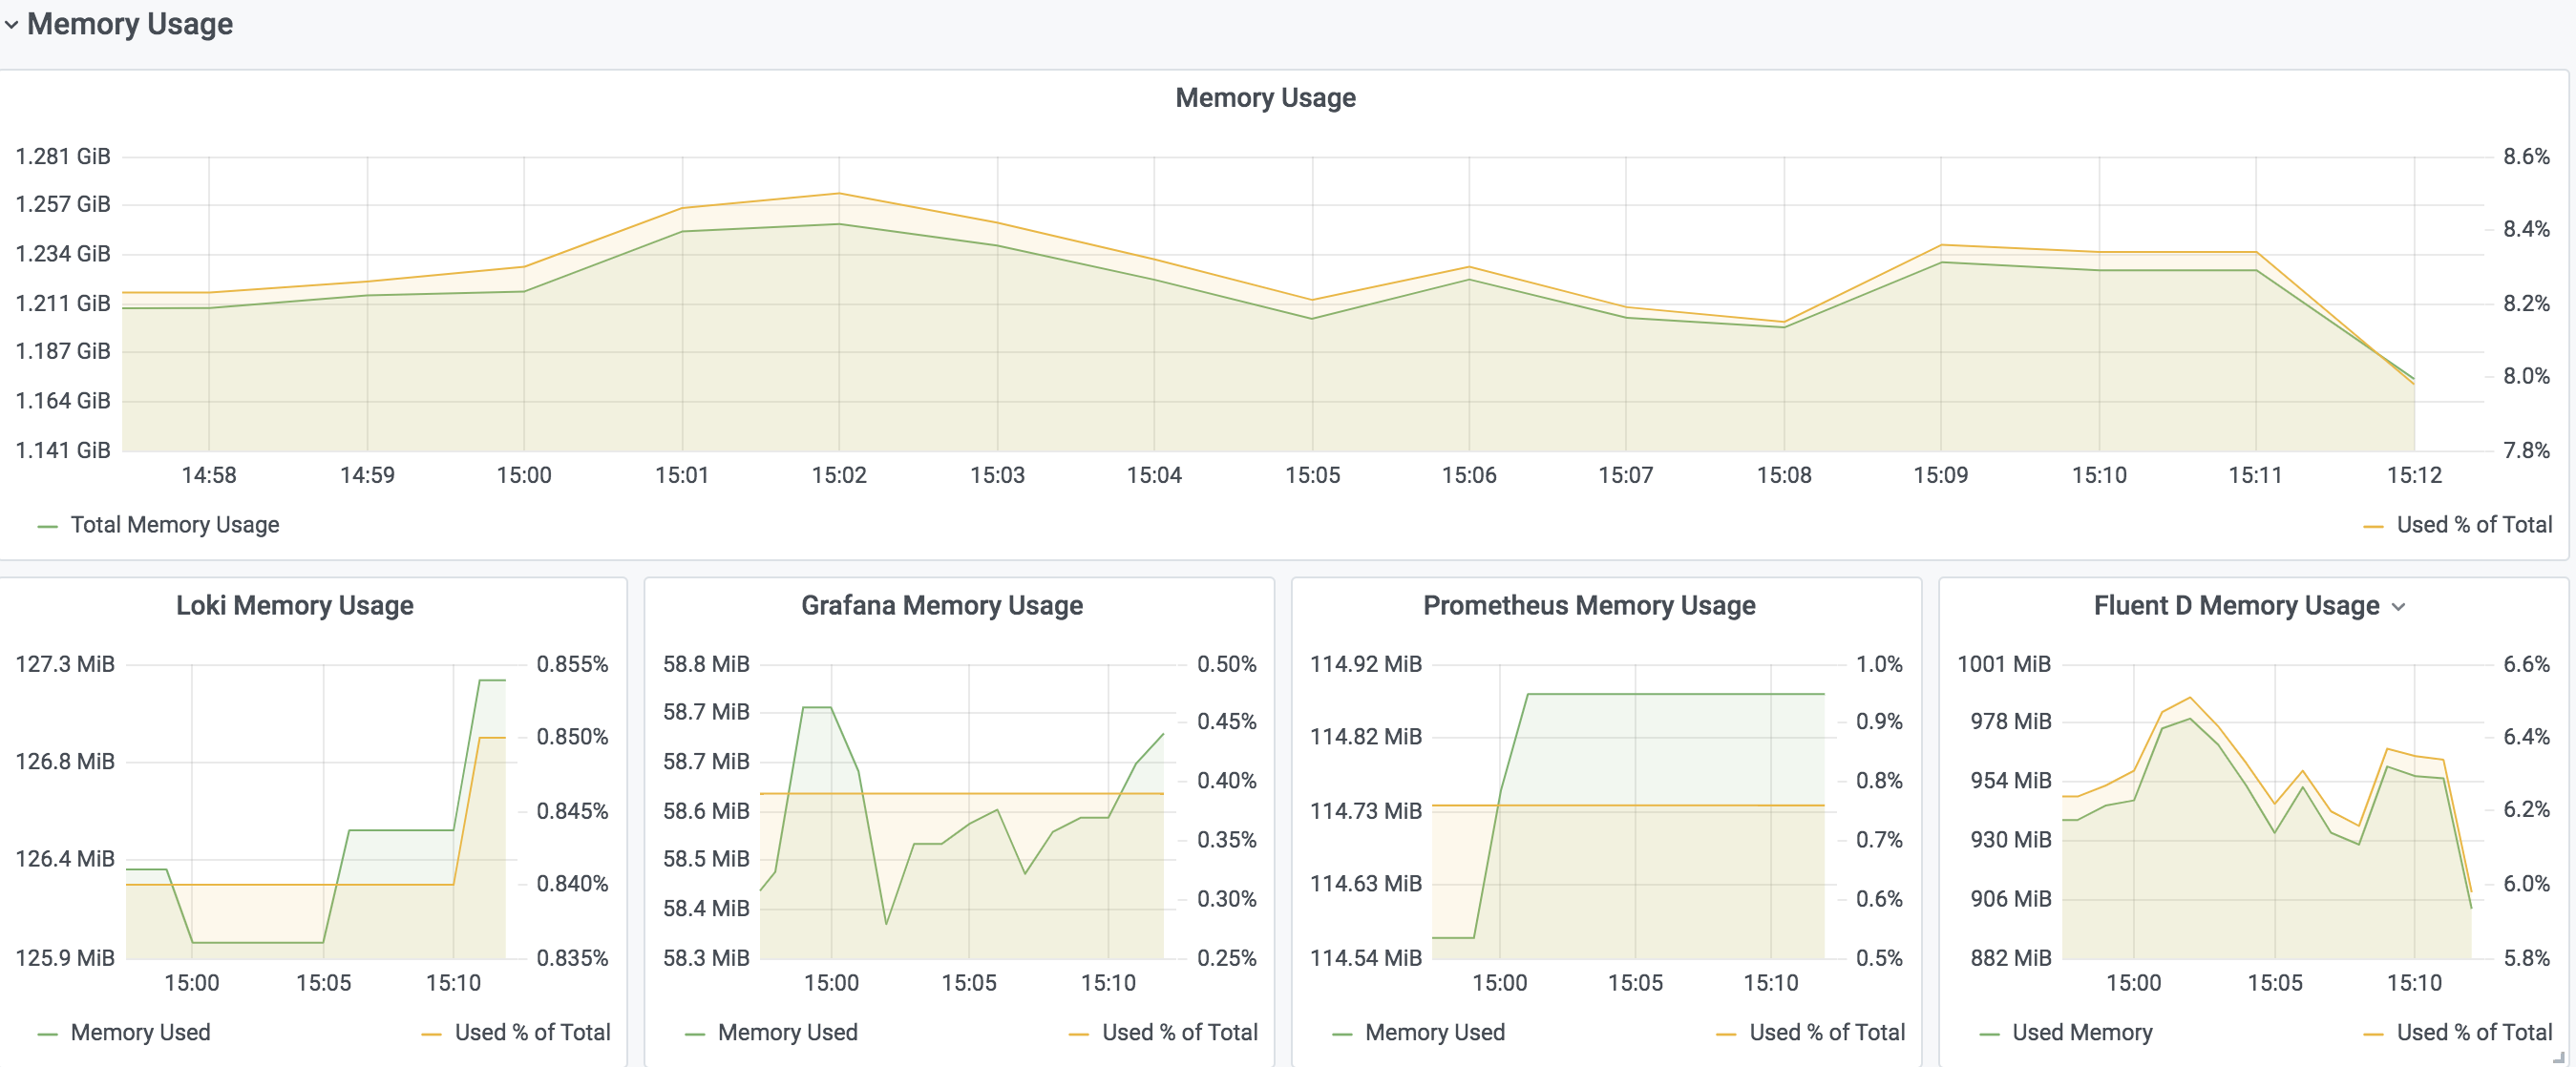
The TML Reporting Metrics page displays the CPU, memory and status of processes running on the tml-reporting pod/container. This panel displays the memory utilization of service and percentage usage against the node's memory. This page also shows the age of different processes on the pod/container. You can select the time range from the top right corner for which data has to be checked. This page require you to select the pod name from the drop down to see the metrics of that pod/container of type tml-log.
Process Status
The
Process Status panel displays the status of all the different processes running on the tml-reporting container/pod. If the process is running properly then this is displayed by a green upward arrow. If the process is not alive then that process's status is displayed as a red downward arrow. This status is plotted at an interval of 1 minute since the metrics collection interval is 1 minute.
Process Uptime
The
Process Uptime panel displays the age of all the different processes running on the tml-reporting container/pod. This can be used to monitor if the age of the process is the same as the pod's age or if it is getting restarted.
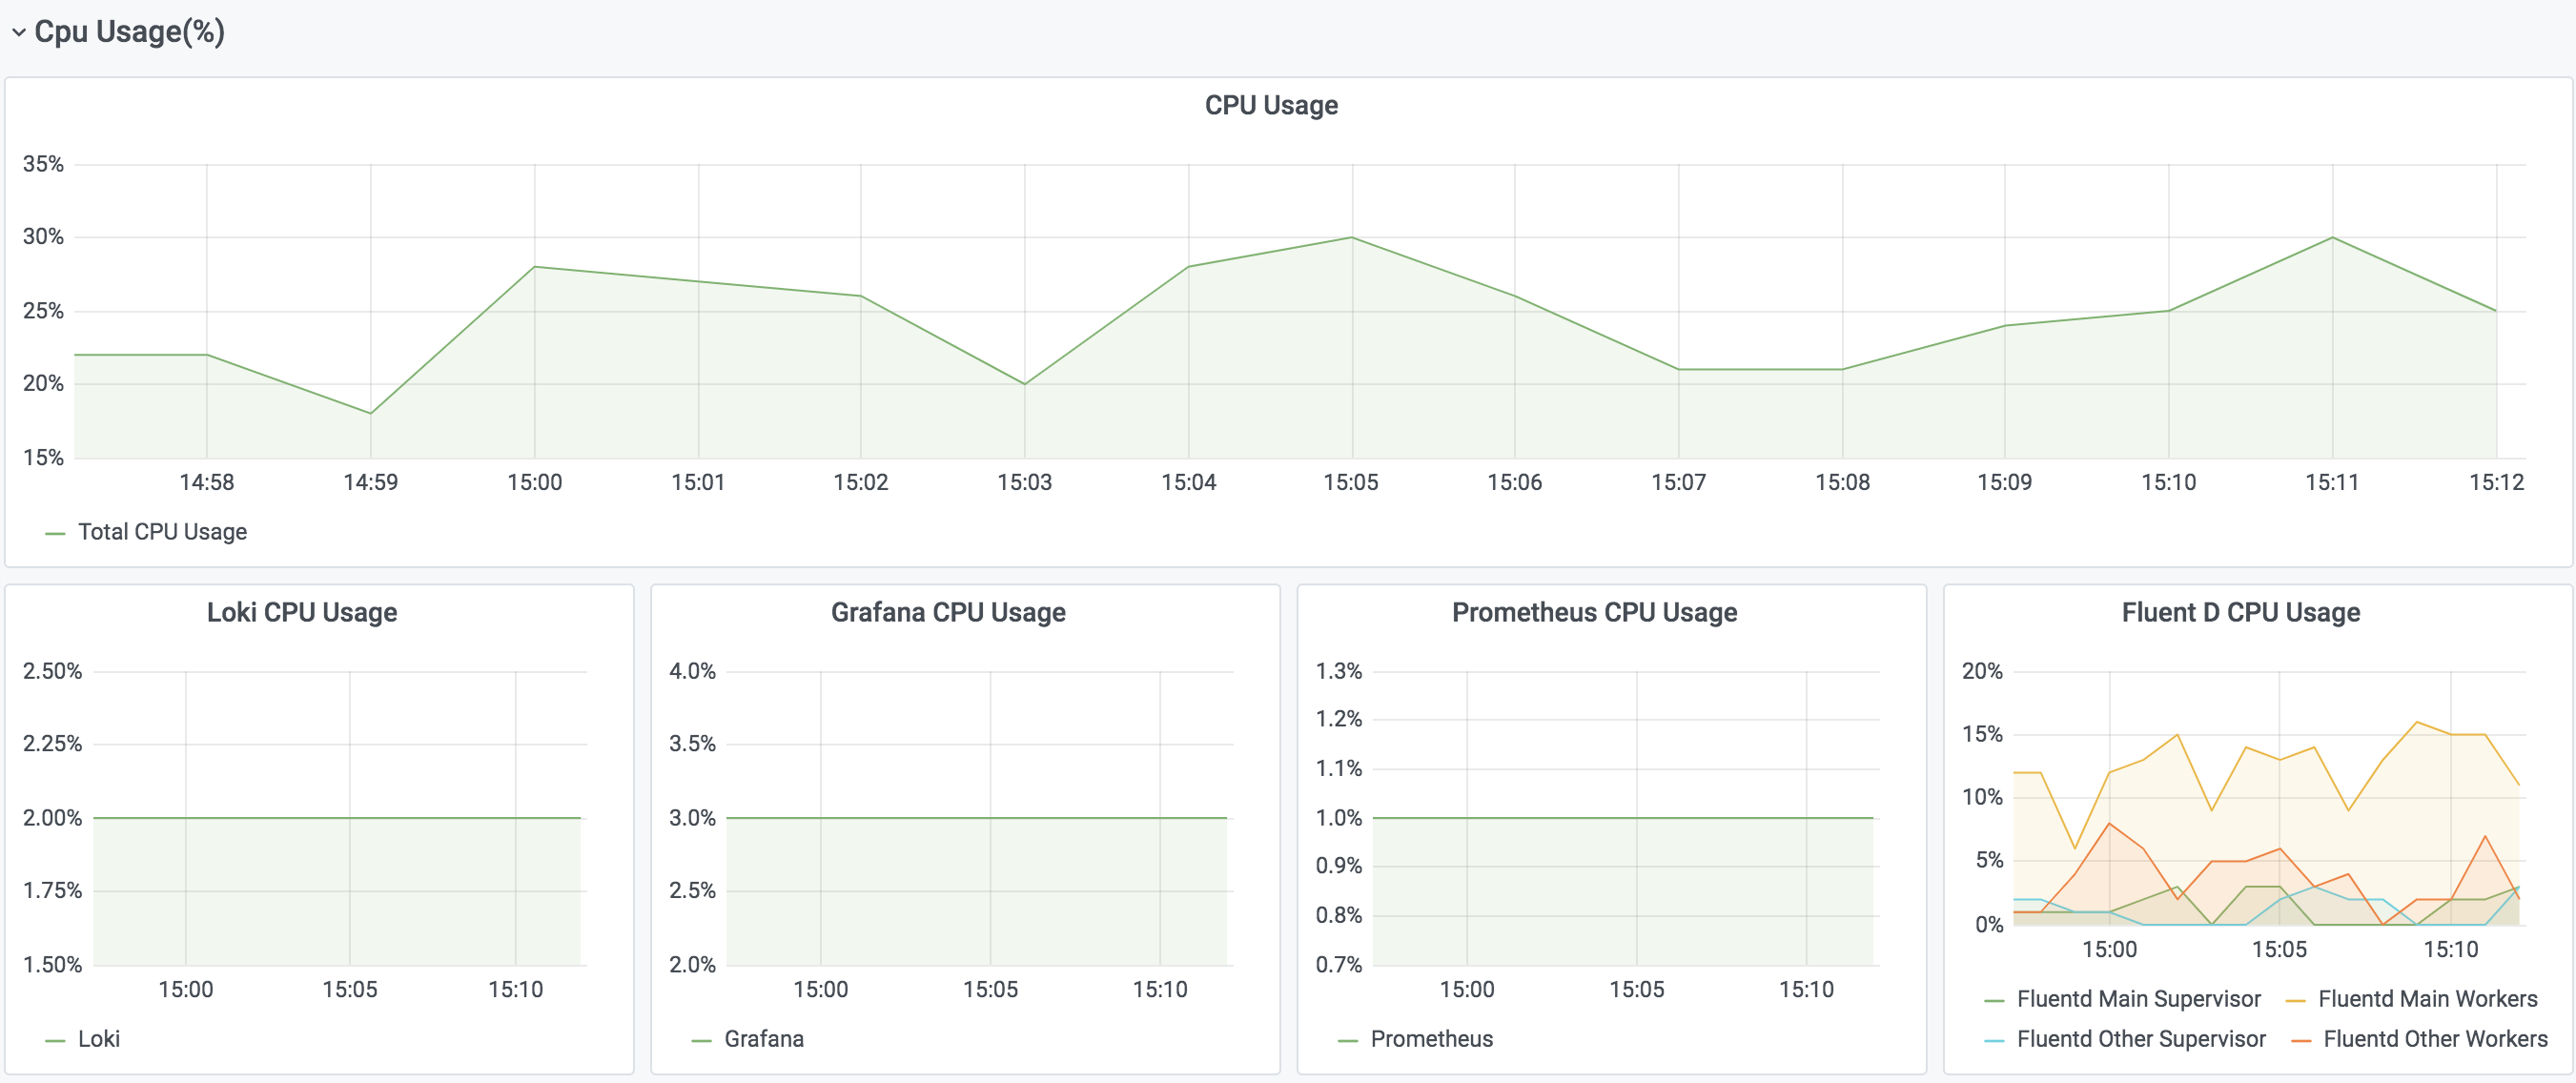
CPU Usage(%)
The
CPU Usage(%) panel displays the CPU used in terms of percentage. These are direct representations of percentage usage per core as shown when you run the top command on any linux system. It doesn't average out the CPU usage against all the cores present on the box since you would see usage more than 100%. This panel displays the aggregated CPU usage by all the processes and CPU usage by an individual process.

