Reporting Services Architecture
The Reporting service container is a composite service running the following:

Services Hosted by Reporting Services Container
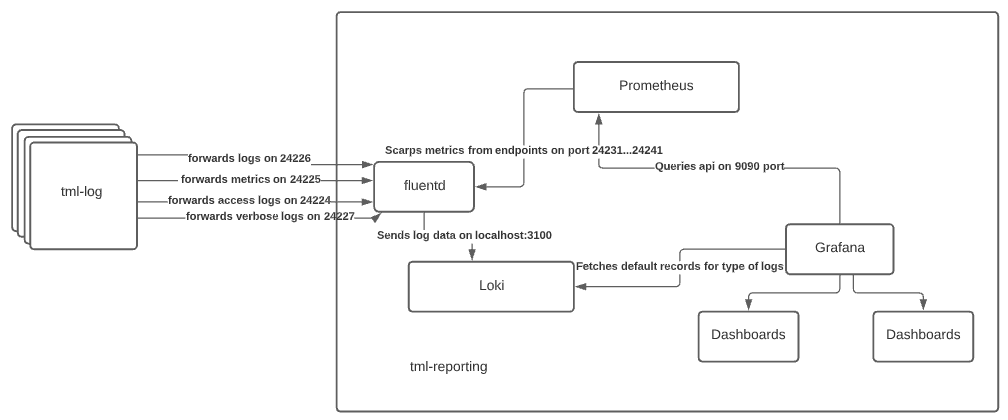
The Reporting Services Container hosts different services to receive, transform, aggregate and visualize data from tml-log service. The Container hosts the following services:
- Loki: Loki is a horizontally-scalable, highly-available, multi-tenant log aggregation system. Loki stores the container logs and verbose logs, which is then used by Grafana to visualize using Explore view.
- Prometheus: Prometheus is an open-source systems monitoring and alerting toolkit that is used to collect counts for access logs and metrics using pull mechanism from the fluentd scrap path.
- Grafana: Grafana is an open-source platform for data visualization, monitoring and analysis that is used to visualize the Prometheus data points.
- Fluentd: Fluentd is used to consume data from log service and perform count aggregation for access logs and split metrics logs into different metrics data points. This can be extended further to transform logs to support data models for Prometheus and Loki.
How the Reporting Service is Deployed
The Reporting service deployment follows the side car design pattern, making it an opt-in service for users. It can be switched on or off. It is recommended to run the reporting service on a swarm or K8s node, which is not used by the TML components.
How the Reporting Service is Deployed for Quick Start Deployments
In the case of a
quick start deployment of the TML cluster:
Copyright © 2022. Cloud Software Group, Inc. All Rights Reserved.
