TML Verbose Logs
The
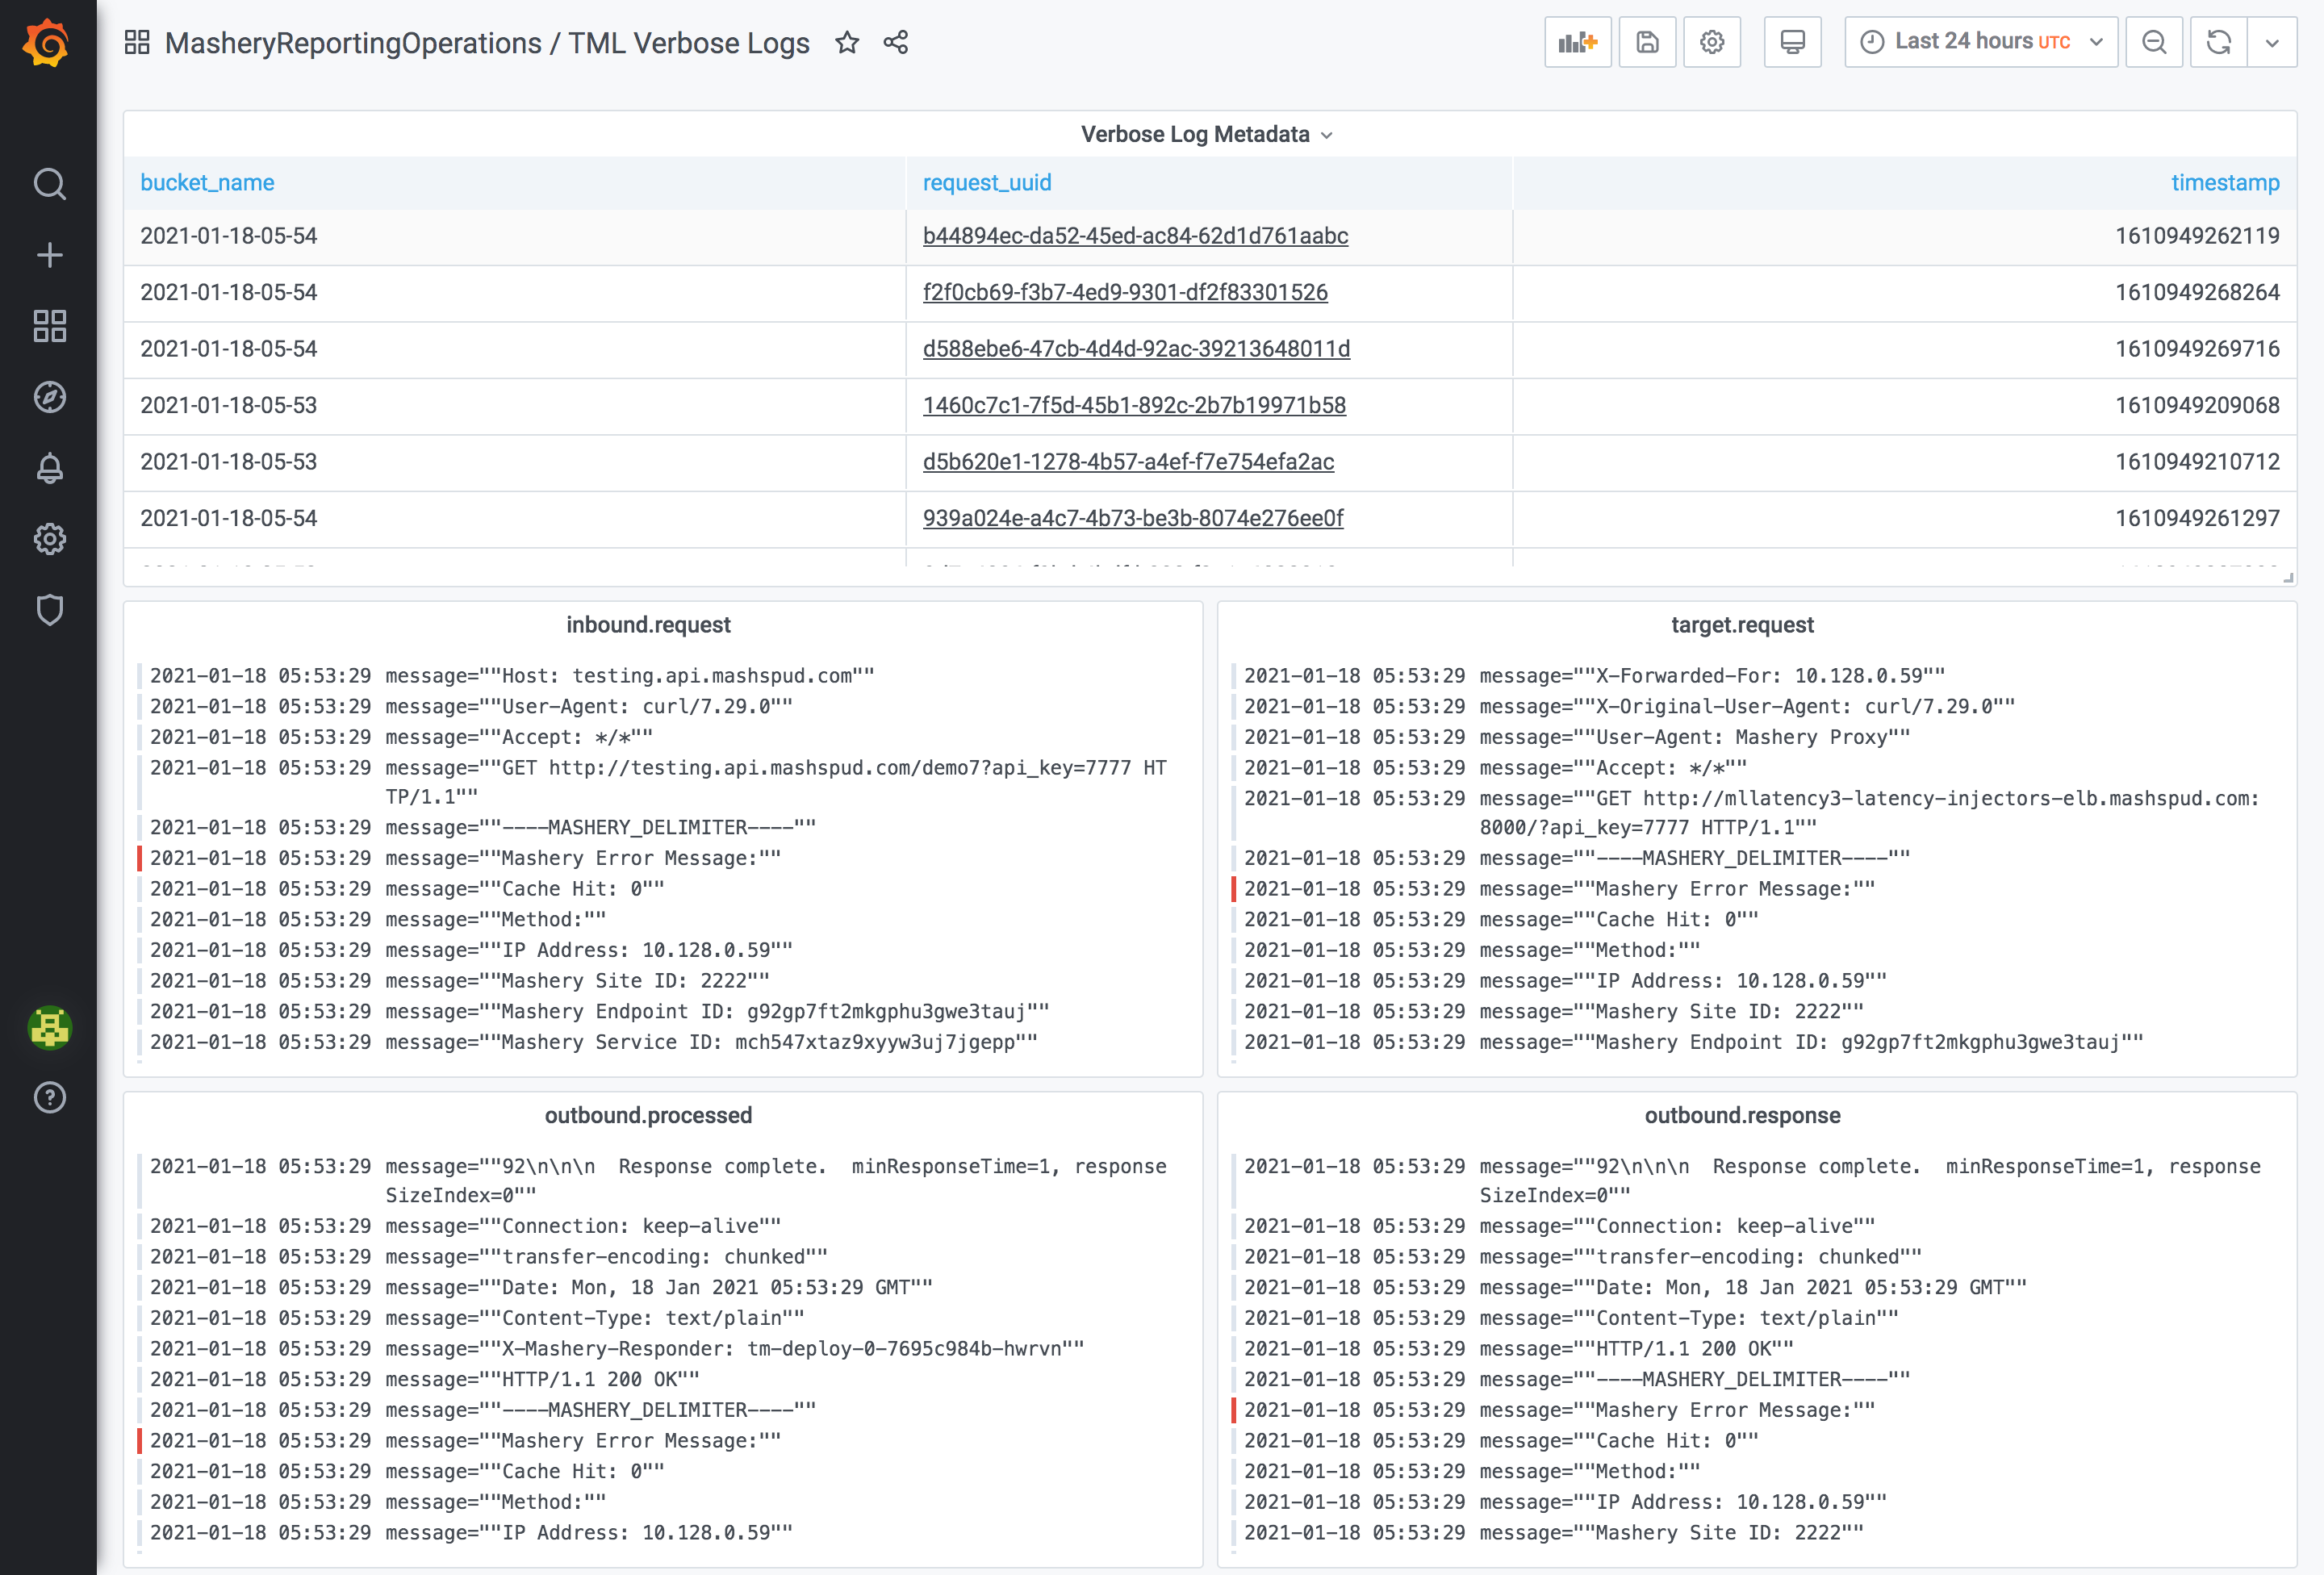
TML Verbose Logs displays the logs that are generated when you enable the verbose feature that is similar to the verbose logs that are stored on the tml-log pod/container. This enables you to debug the API in terms of the request sent to Mashery, (for example,
InboundRequest), a request sent to the backend (for example,
InboundProcessed(TargetRequest)), a response received from the backend (for example,
OutboundResponse(TargetResponse)), and a response sent back to the client (for example,
OutboundProcessed).
This graph requires you to select the
request_uuid from the
Verbose Log Metadata table so that the following log panel displays each type of logs for that
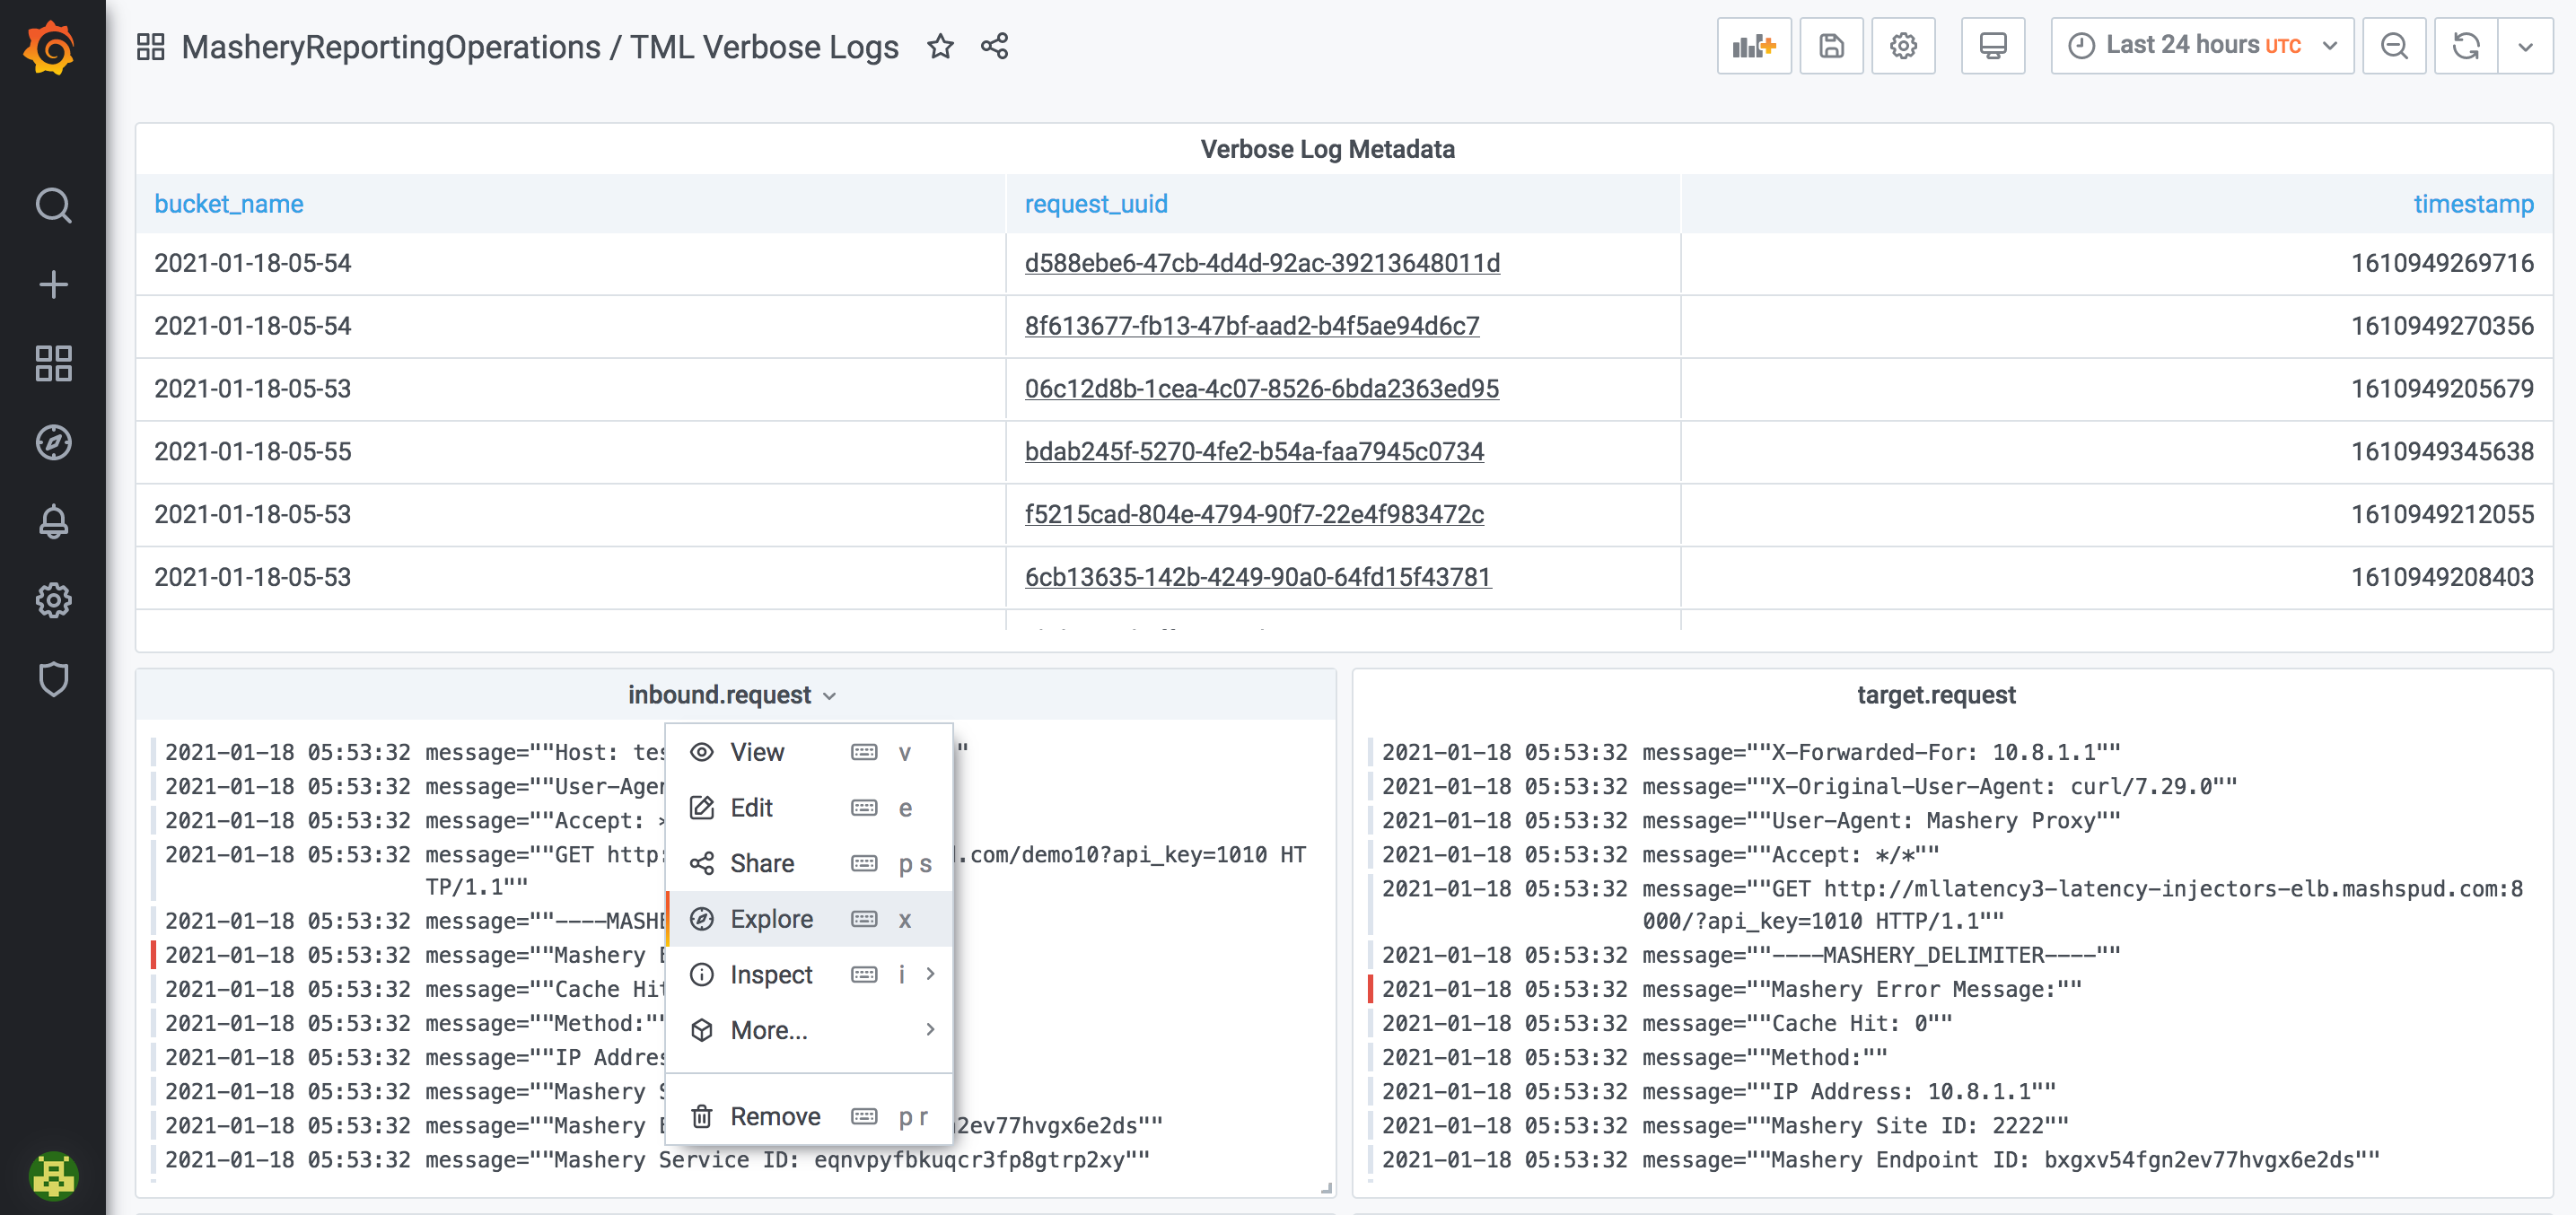
request_uuid. You can explore each type of logs in Grafana's Explore view by clicking on the log panel's down arrow and selecting the
Explore view. This displays the logs in
Explore view.
