Customer Traffic Summary
The
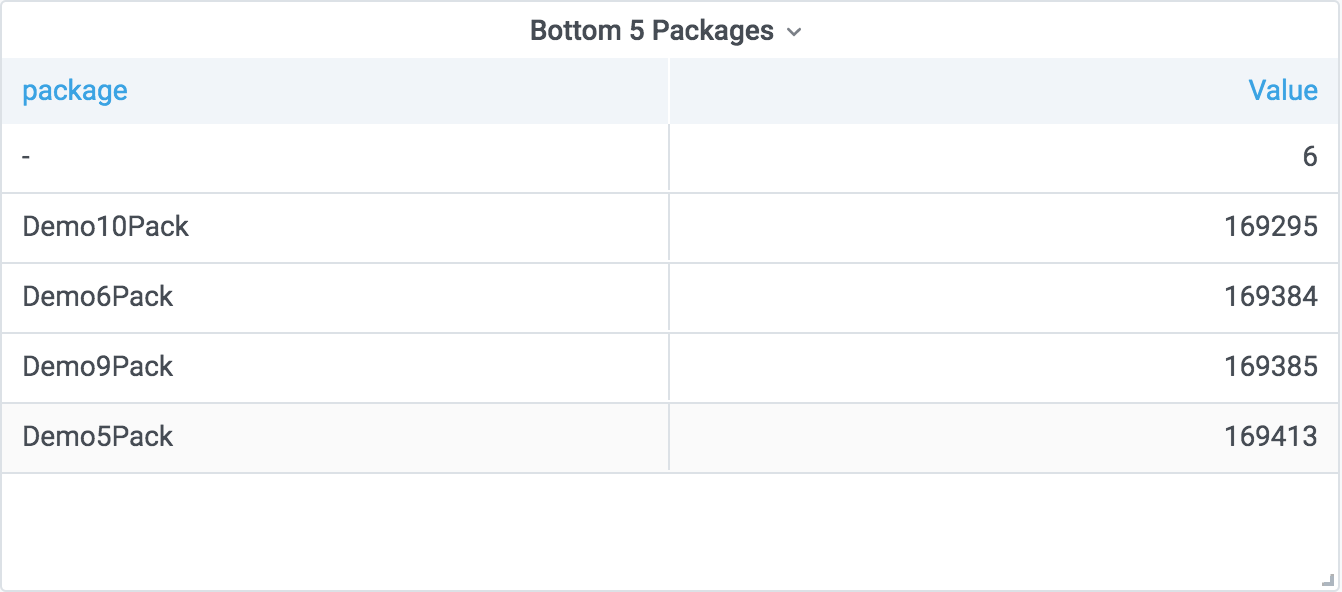
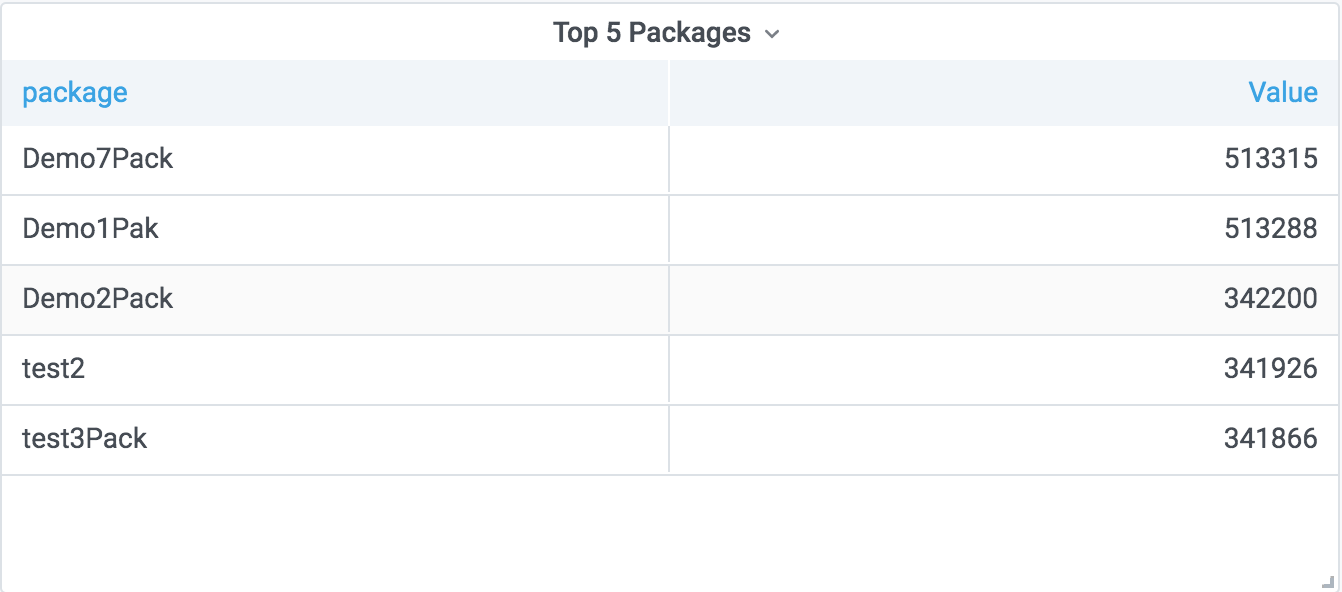
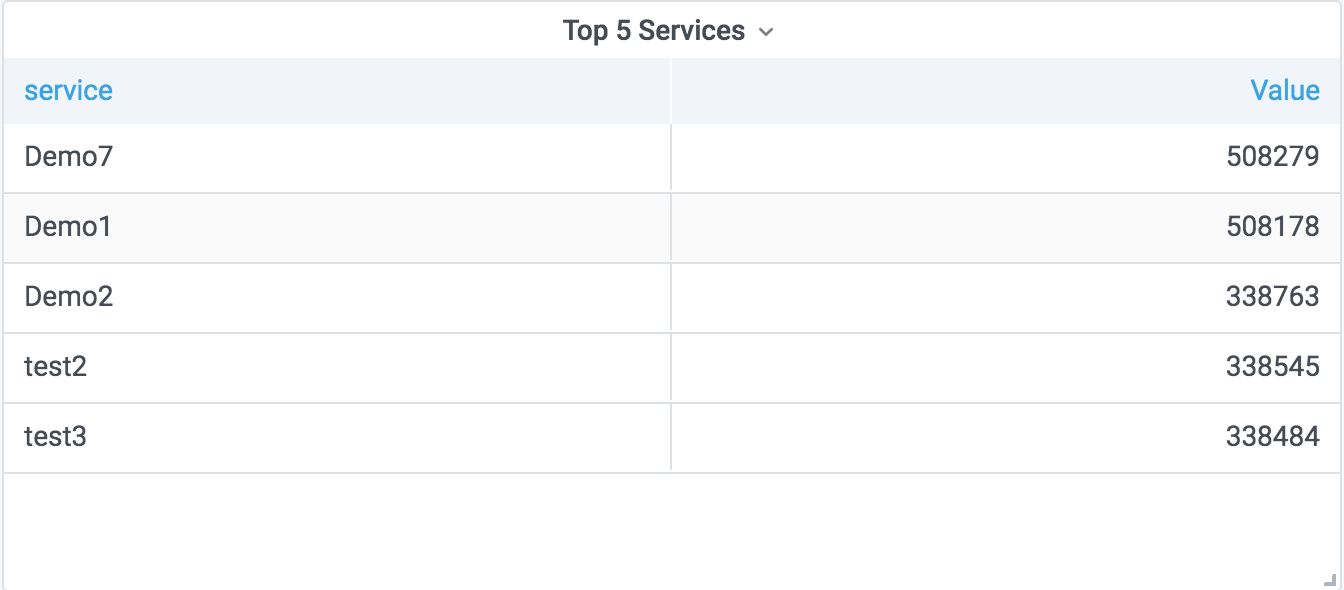
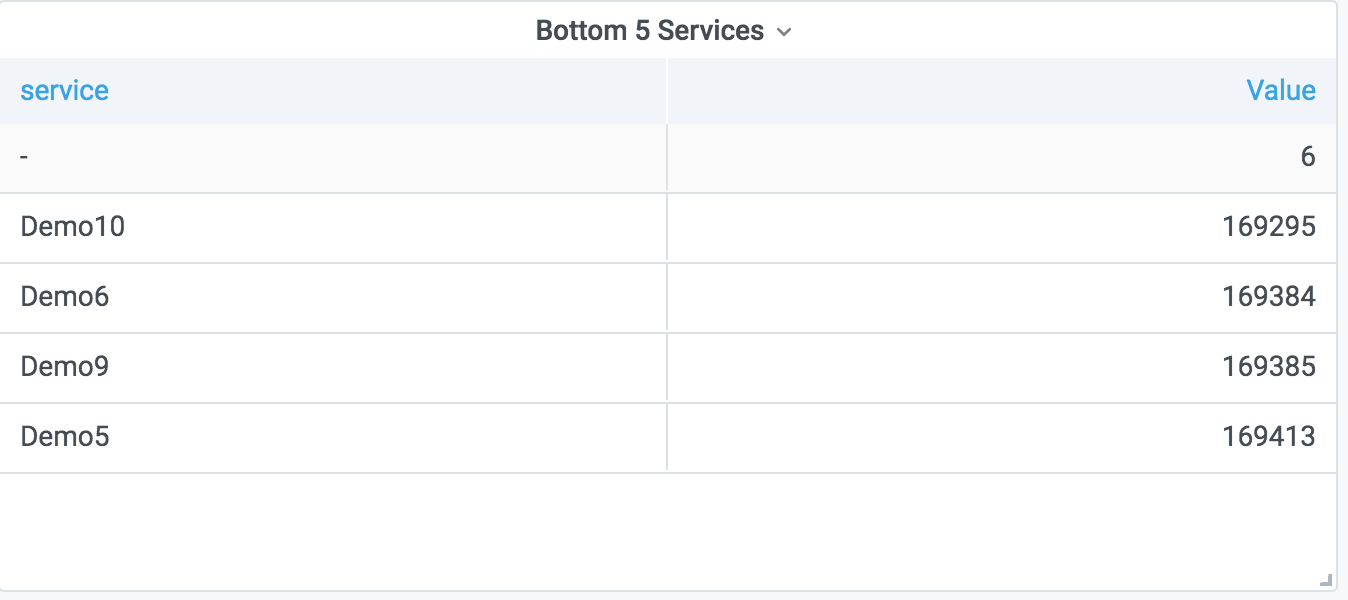
Customer Traffic Summary page displays the different tables showing summary of calls count for different months, percentage of successful, blocked and other calls in the current month. This page also displays the data about the top 5 services used and its call counts in the current month; top 5 packages used and its call counts in the current month; and bottom 5 services and packages used along with call counts in the current month. The data is extracted from the data paths exposed on fluentd service and get scrapped by the Prometheus service. This data is stored on the Prometheus database, for example, the file system mounted on the attached volume.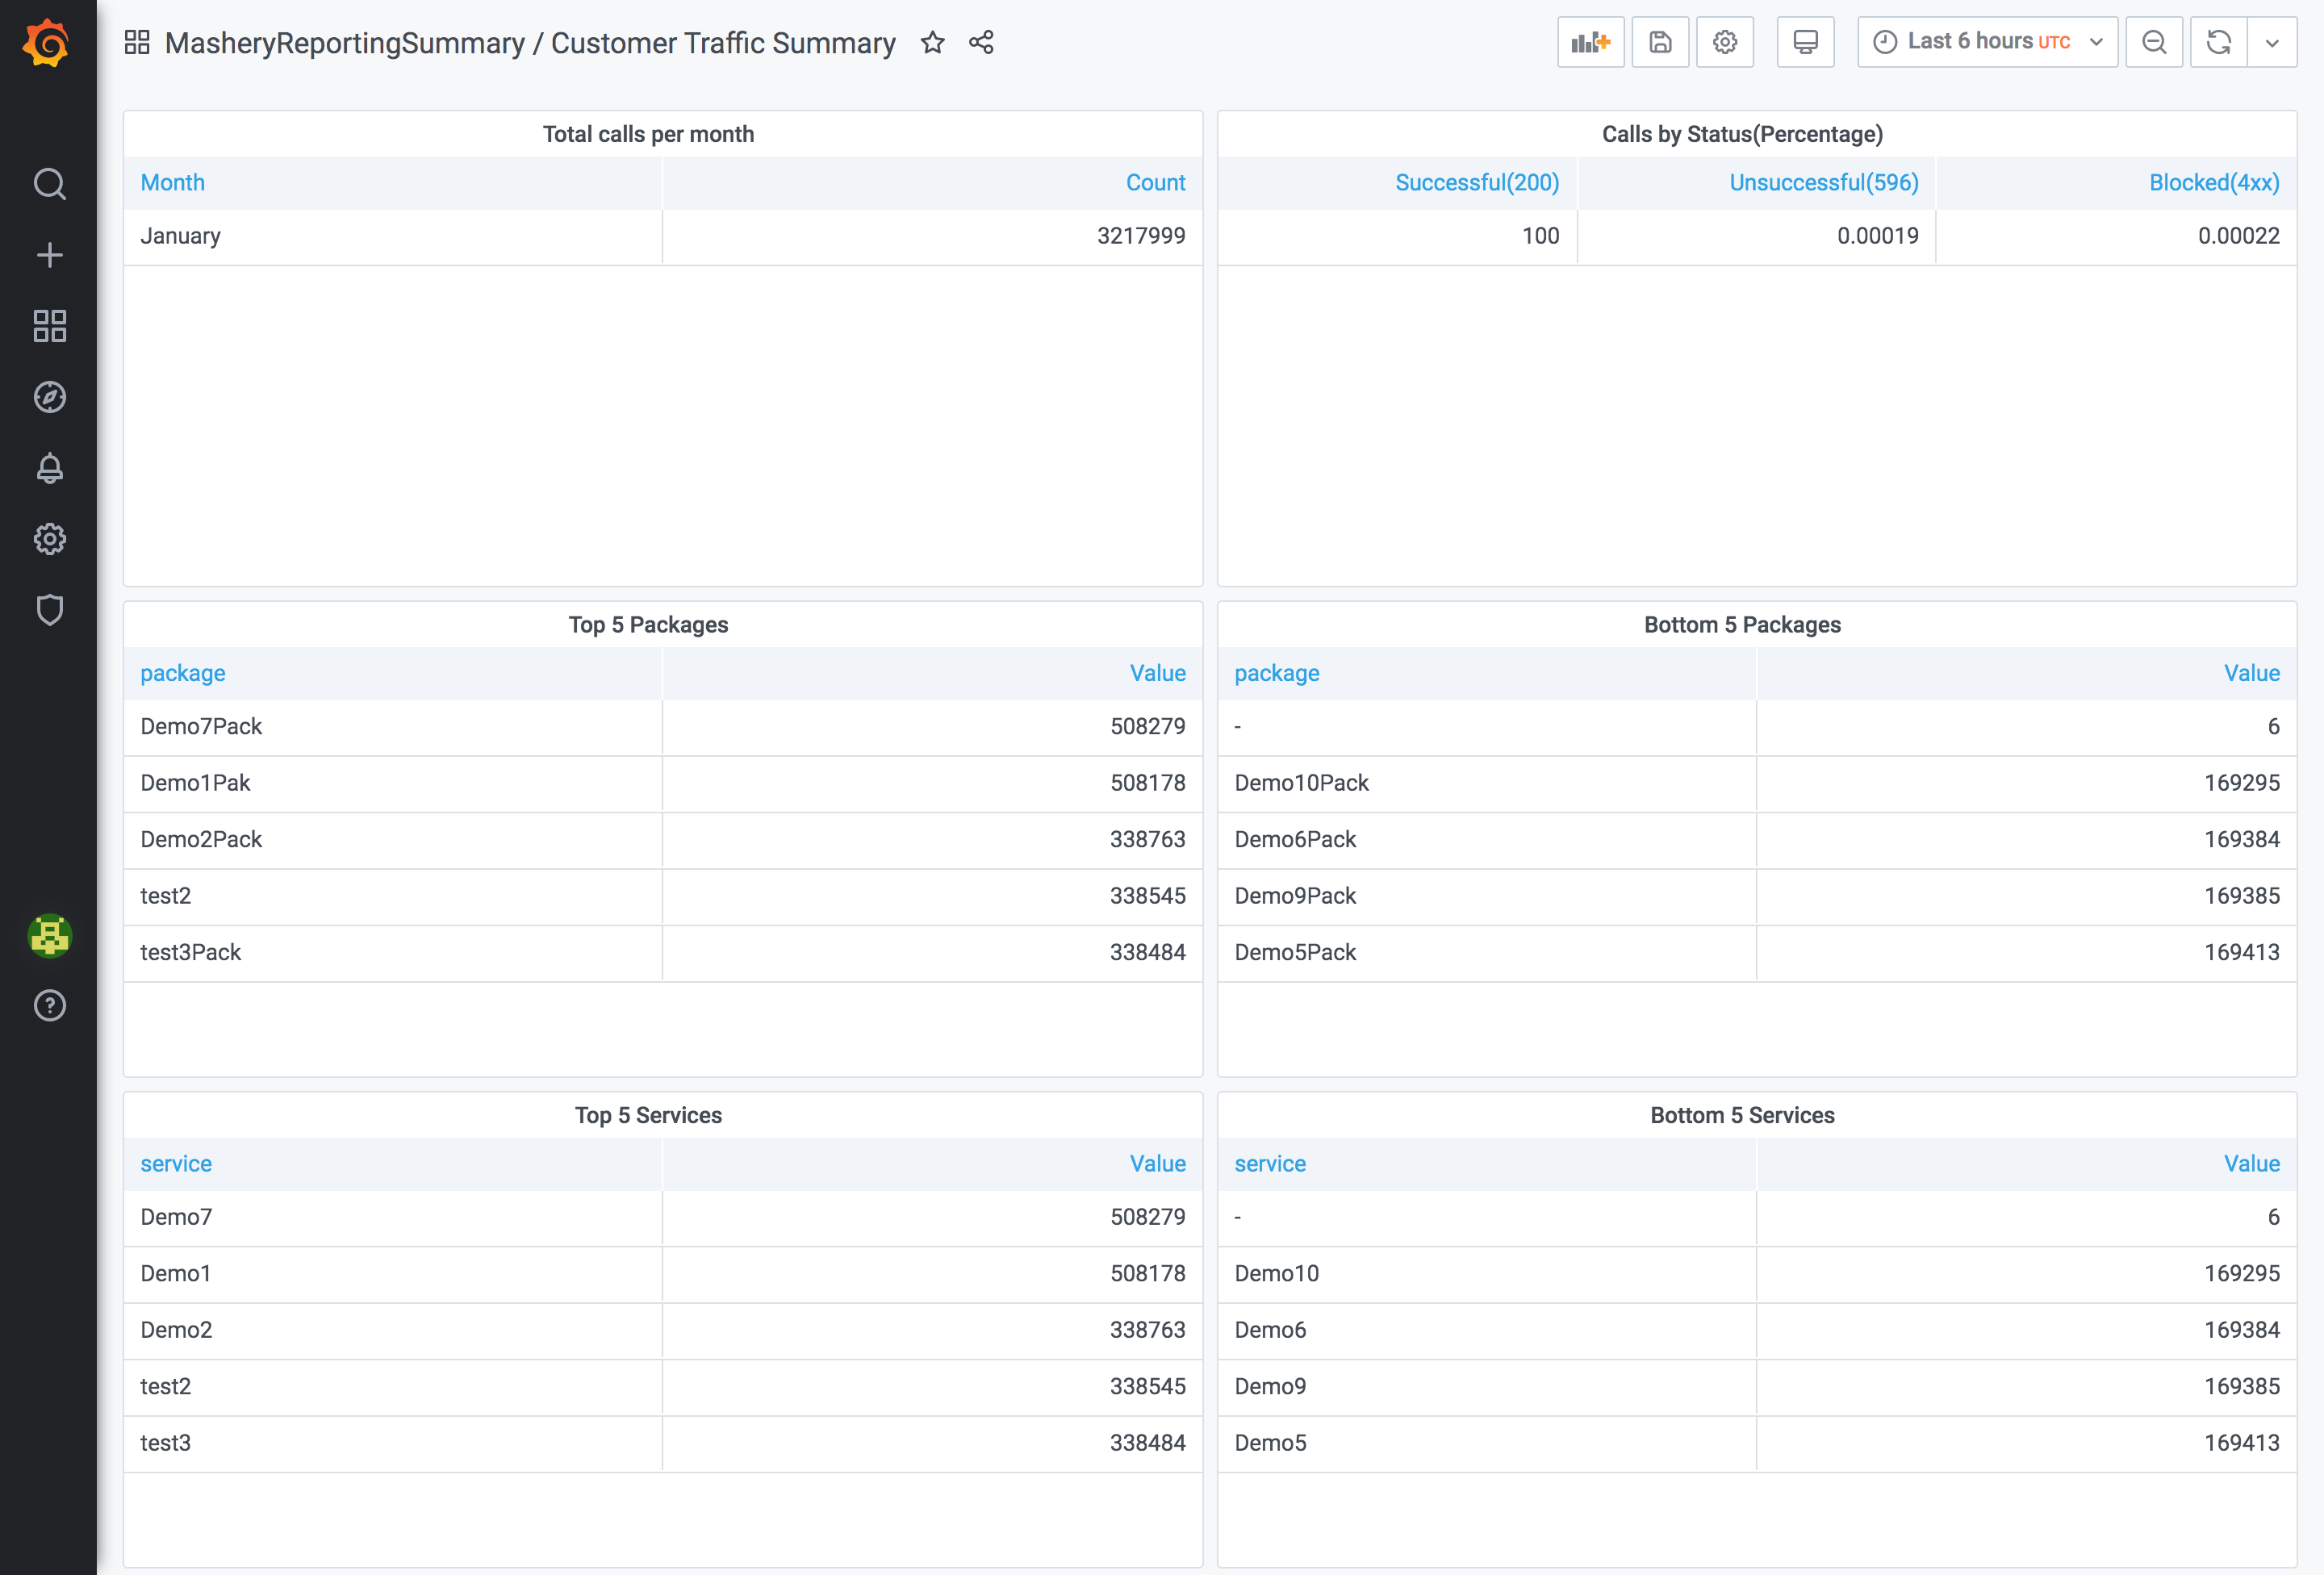
Total calls per month
The
Total calls per month panel displays the table which shows the call count for different months. This panel does not display data older than a year. This does give the total count of calls served by the tml-cluster for the given month.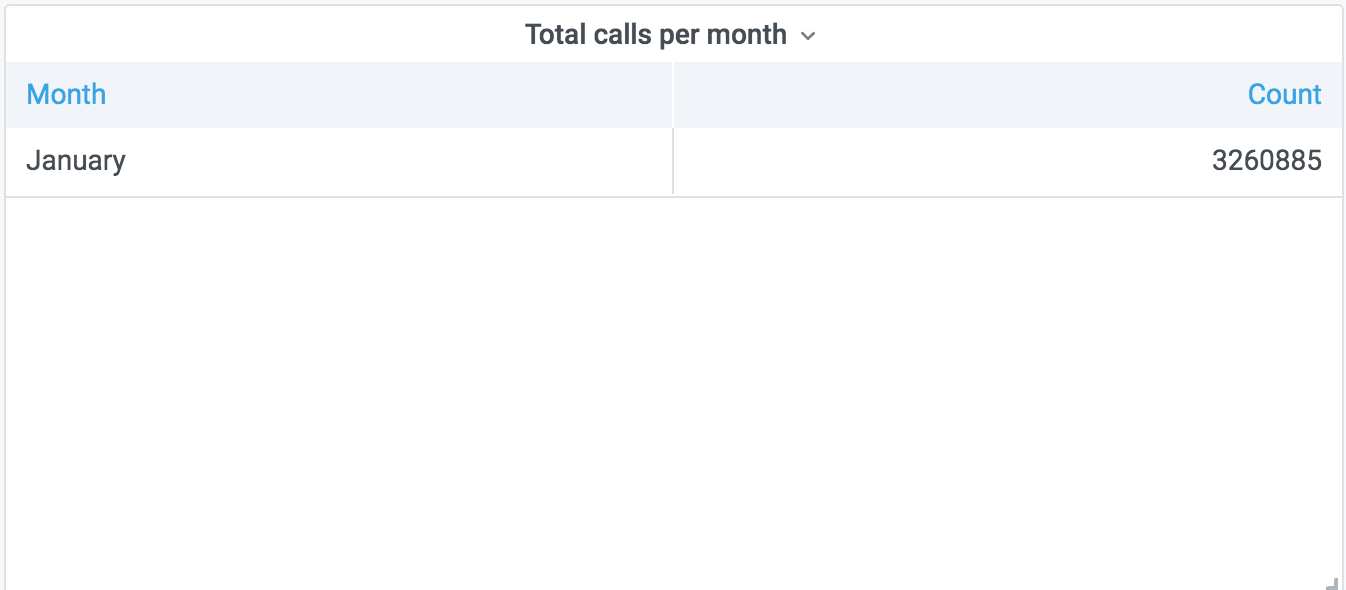
Calls by Status(Percentage)
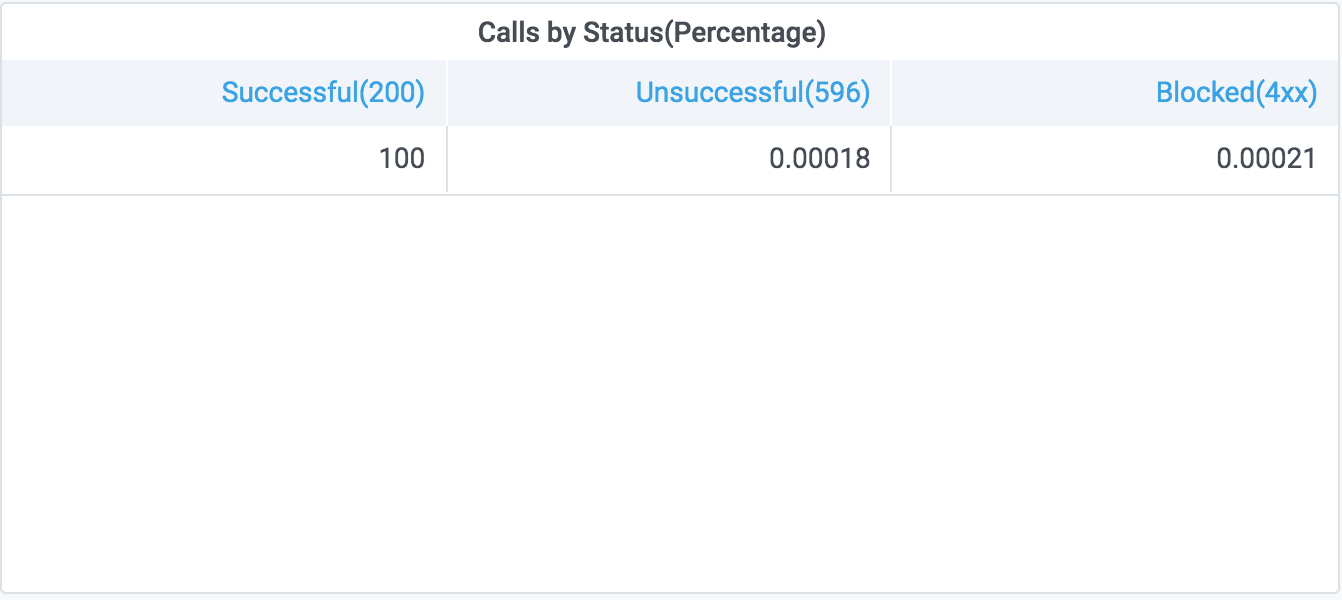
- Successful: This displays the percentage of traffic calls for the status code 200 in the current month.
- Blocked: This displays the percentage of traffic calls for the status code ranging from 400 to 499 in the current month.
- Others: This displays the percentage of traffic calls for the status code other than the above two conditions in the current month.
Bottom 5 Packages
The
Bottom 5 Packages table shows the 5 lowest used packages in the current month.