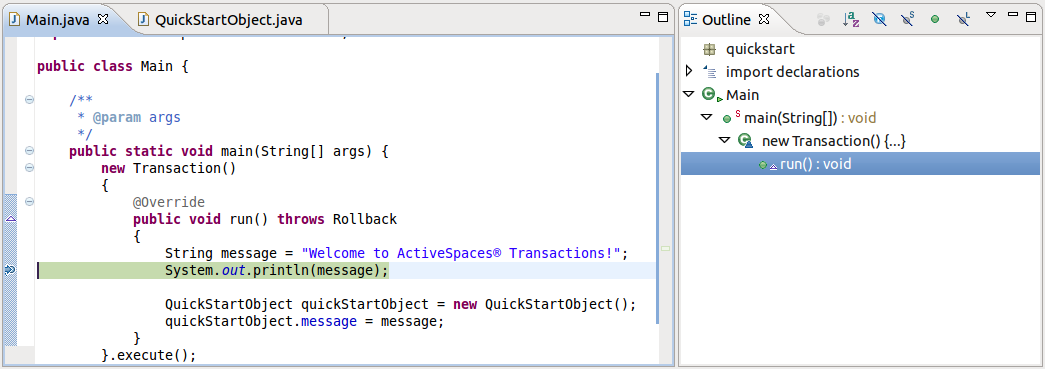
Debugging the application is a two-part process. First you run the
application using the Debug run configuration, which
will start the debug listener on the application node. Then you launch the
Eclipse remote debugger and connect to the Virtual Machine.
Set a breakpoint in your application: select a source line in the
mainmethod. Under the "Run" menu, select "Toggle line breakpoint".Under the "Run" menu, select "Run Configurations...". Select the Debug configuration.
Click the Run button to start the application. You'll see output in the console window ending with:
[A] Listening for transport dt_socket at address: 6666
Now, choose the Debug perspective (the selector is in the top right tab, or look under the "Window" menu and select "Open Perspective").
Under the "Run" menu, select "Debug Configurations".
In the left pane, select the debug configuration created earlier - the default name is QuickStartObject.
Click the Debug button.
Eclipse returns to the debug perspective, and the Eclipse remote debugger connects to the application node. The application will start and run until the breakpoint you set is reached.
Now you can:
As you debug the application, its console output continues to be displayed in the debug perspective Console tab.
