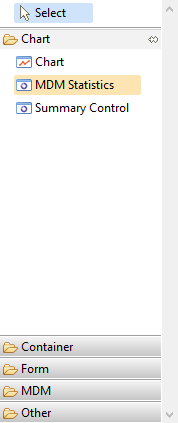
Chart Widgets
The Chart category contains different types of chart controls which help in building the UI.
To create a UI, you must select a chart control and drop in the tree outliner viewer.
| Chart | |
| Chart
Chart Widget provides an intuitive way to monitor the data quality. Using this widget, you can define a line chart to monitor the data quality of attribute |
|
| MDM Statistics
MDM Statistics widgets provides pie charts and number display to monitor the event summary, work item summary, and query summary. |
|
| Summary Control
Summary Control widget provides a radial progress chart to monitor the data quality of attribute. |
|
Copyright © Cloud Software Group, Inc. All rights reserved.