MDM Statistics
The MDM Statistics widgets provides pie chart and number display to monitor the event summary, work item summary, and query summary. The event summary pie chart displays the number of success events and failure events. The query summary displays the total number of queries executed and average execution time in specified minutes. The work item summary pie chart displays the number of cancelled, closed, open and timeout events.
| Properties | Description |
|---|---|
| Advanced | |
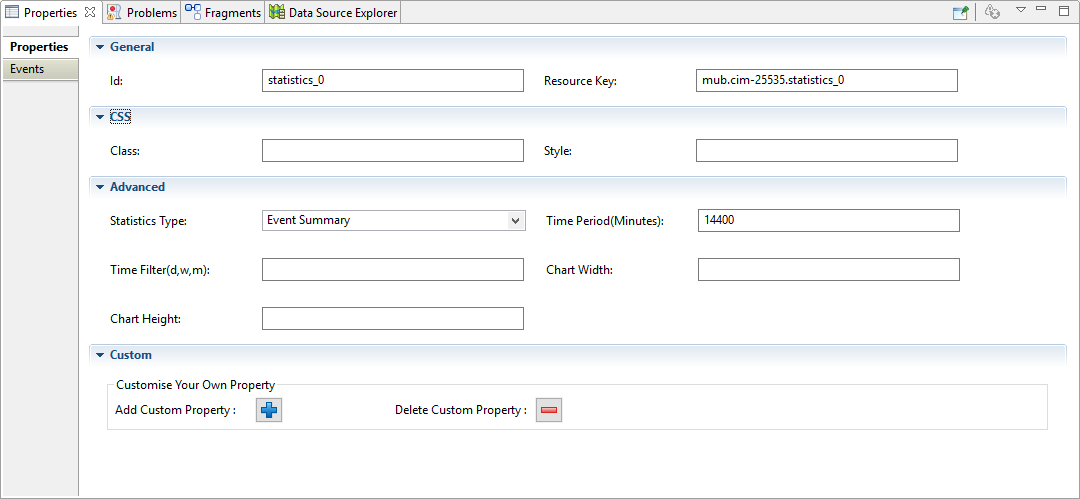
| Statistics Type: | Select the type of statistic summary. They are event summary, query summary and work item summary. |
| Time Period(Minutes): | Input time interval of event summary or query summary collection in minutes. The type of the value is integer. This value is used for event summary and query summary. |
| Time Filter (d, w, m) | Input the time filter separated by comma. The symbols can be used as time filters are 'd', 'w' and 'm'. 'd' means a day; 'w' means a week; 'm' means a month. For example, "3d, 3w, 5m" defines five time filters. They are from three day until current time, from 3 weeks until current time and from five months until current time. This value is used for workitem summary. |
| Chart Width: | Input the width of the pie chart or number box. The type of value is integer such as 300. |
| Chart Height: | Input the height of the pie chart or number box. The type of value is integer such as 150. |
Copyright © Cloud Software Group, Inc. All rights reserved.