Chart
Chart Widget provides an intuitive way to monitor the data quality. Using this widget, you can define a line chart to monitor the data quality of attribute. In addition, you can also filter the data using time filter and category filter.
| Properties | Description |
|---|---|
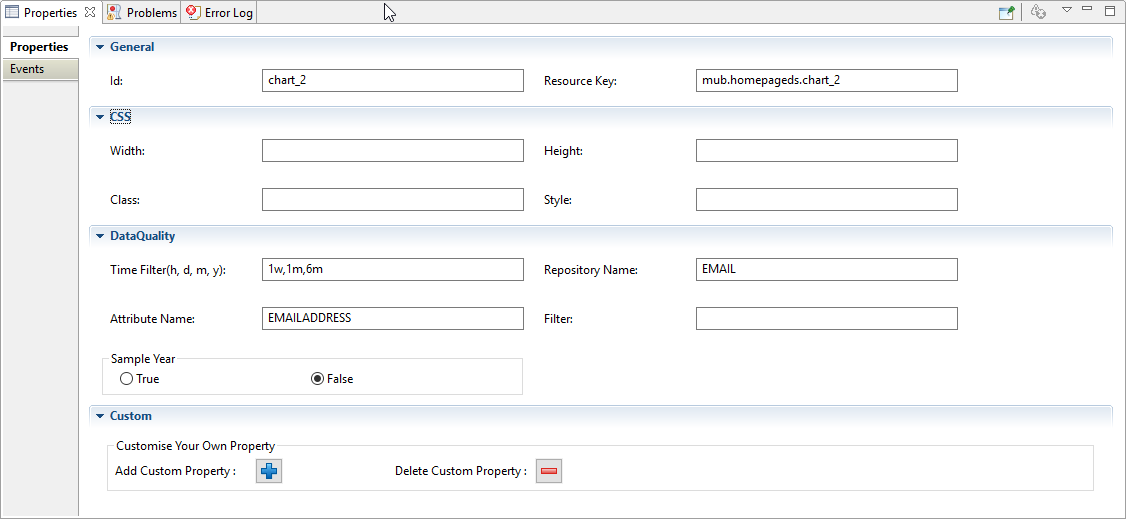
| DataQuality | |
| Time Filter (h,d,m,y): | Specify the time filter separated by comma. The symbols that can be used as time filters are 'h' (hour), 'd' (day), 'w' (week), 'm' (month), and 'y' (year). For example, "2h, 3d, 3w, 5m, 1y" defines five time filters. They are from two hours until current time, from three day until current time, from 3 weeks until current time, from five months until current time and from one year until current time. |
| Repository Name: | The repository name of the MDM. |
| Attribute Name: | The name of the quality attribute. |
| Filter: | The value of the attribute in which quality attributes are categorized. |
| Sample Year | Specify whether the last one year attribute score info should be returned. The available options are true or false. Select true to return one year attribute score info. |
Copyright © Cloud Software Group, Inc. All rights reserved.