Design-time Resources
Various design-time resource is used to configure TIBCO BusinessEvents Views applications. Each is configured with a wizard.
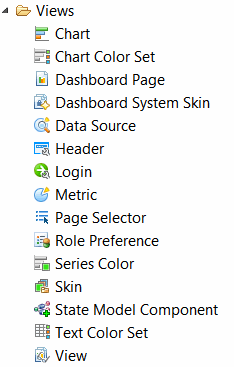
Following is a list of the wizards as it appears in the Select a Wizard interface TIBCO BusinessEvents Studio:
However, these wizards are also are available using the convenient tool bar that presents the configuration actions in a logical sequence for easy application development:
From left to right, the buttons access wizards for configuring the following:
- Metric is a set of formulas computed real-time on data received from events, concepts and scorecards. Data is written to cache and saved to the backing store (if one is configured).
- Data Source is the source of data for a chart or state model component. Data is provided using a query over a metric (that is, metric data in the cache or JDBC backing store, depending on configuration). The query can be parameterized so that Dashboard users can filter data returned.
- Chart Components:
- Chart is the visual representation of real-time business information as computed by metrics. Various types of charts are available.
- State Model Component is the visual representation of a state model, with drillable information at each state. Available only with the TIBCO BusinessEvents Data Modeling add-on.
- Page Selector allows business users to switch between the dashboard pages available for their role.
- Dashboard Page displays a collection of dashboard components across multiple panels and partitions.
- View is the collection of dashboard pages to be displayed to a user role.
- Role Preference helps you make business information accessible to a group of users depending on their organizational role.
- Skin Colors and System Skin The system skin and custom skin features provide a range of appearance options used to configure dashboard components. If you prefer to use system defaults, which are designed to provide harmonious chart and dashboard pages, do not enable the skin feature.
- Global Configurations:
Other Useful Concepts
- Data Point is a metric value that is represented in a dashboard component. A data point is generated by the underlaying data in the metric, and is updated in real time. In graphical charts, a data point lies at the intersection of:
- Alerts are visual notifications that you can configure for a range of values in a chart or state model component. For charts, alerts are configured on the Chart resource Alerts Settings tab. For state model component, alerts are configured on the Sate Model Component resource Indicator Data and Indicator Alerts tabs.
- Search Page if enabled, provides more detailed business information. Dashboard users access this page by drilling down on a data point or an alert to learn more about the data or by clicking the Search link in the Dashboard header. They can also use ad-hoc queries on the search page to explore the data behind the charts. The drillable fields options affect the search page. These options are on the Chart resource Data Settings tab and on the State Model Component Content and Indicator Data Settings tab.
Copyright © Cloud Software Group, Inc. All rights reserved.

